. 2010 Nov;120(11):4091-101.
doi: 10.1172/JCI43873. Epub 2010 Oct 25.

Mammalian target of rapamycin activation underlies HSC defects in autoimmune disease and inflammation in mice

Affiliations

Mammalian target of rapamycin activation underlies HSC defects in autoimmune disease and inflammation in mice

Chong Chen et al. J Clin Invest. 2010 Nov.

Erratum in

  • J Clin Invest. 2010 Dec 1;120(12):4583

Abstract

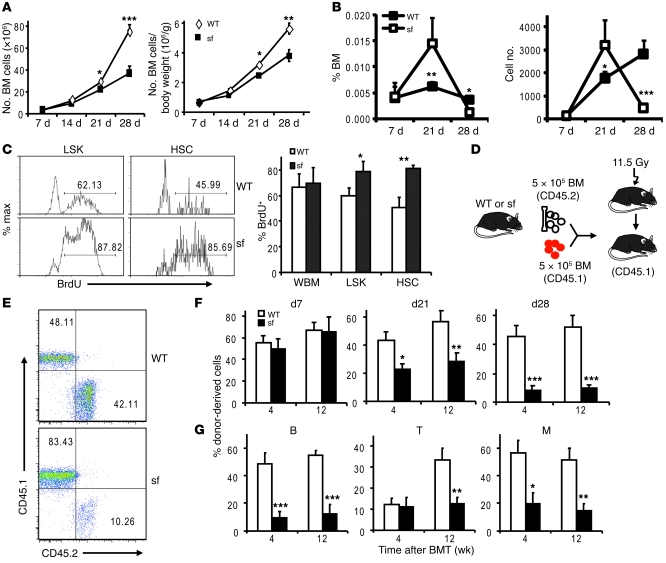
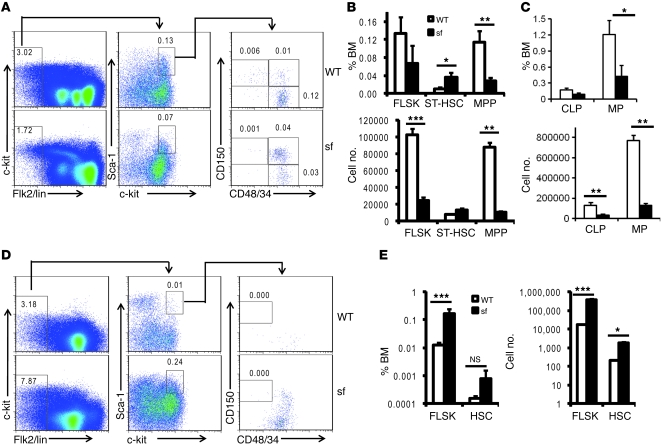
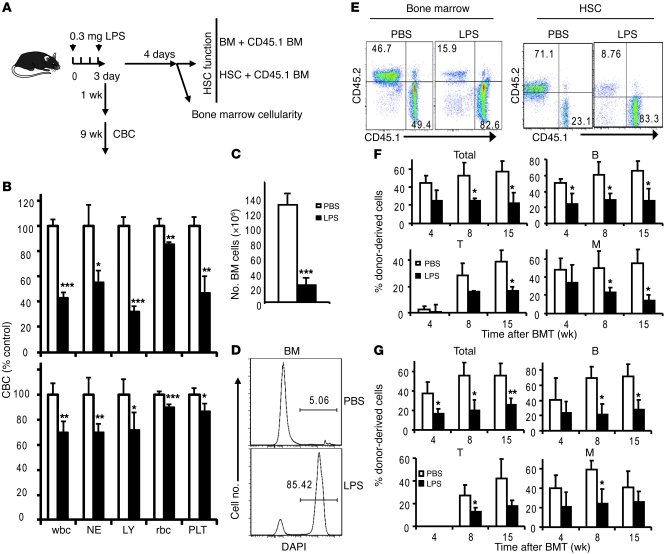
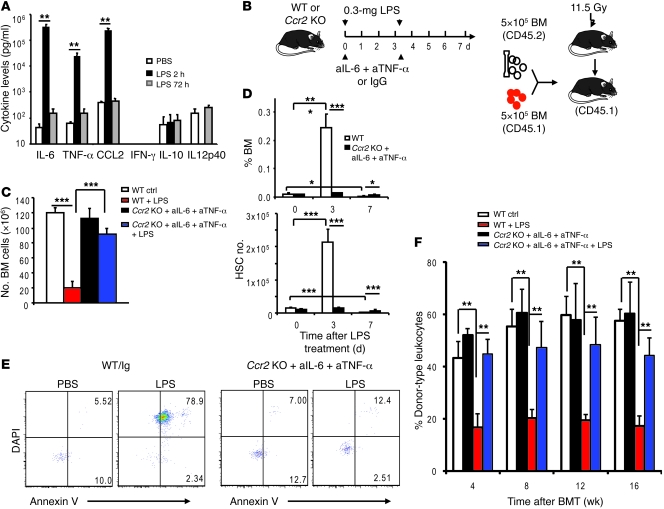
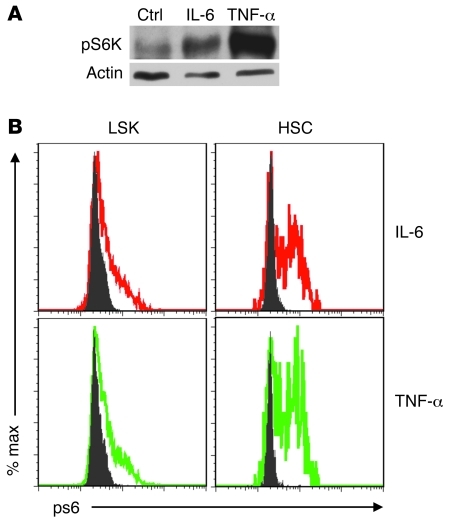
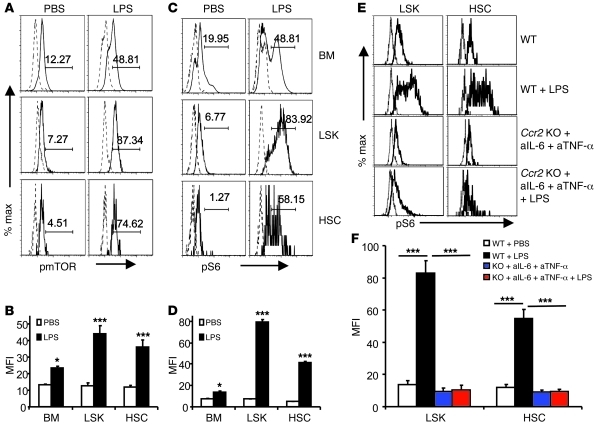
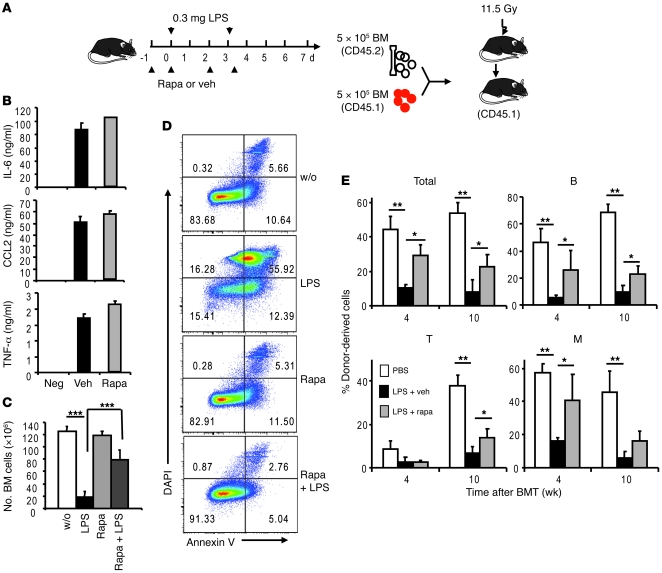
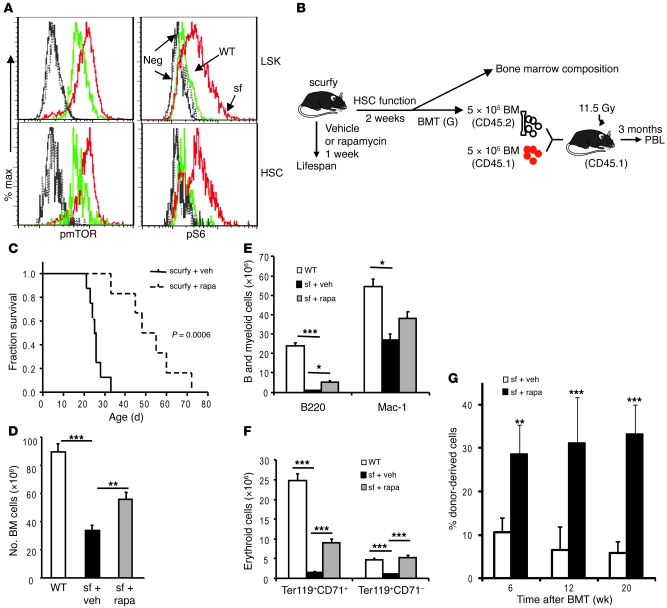
The mammalian target of rapamycin (mTOR) is a signaling molecule that senses environmental cues, such as nutrient status and oxygen supply, to regulate cell growth, proliferation, and other functions. Unchecked, sustained mTOR activity results in defects in HSC function. Inflammatory conditions, such as autoimmune disease, are often associated with defective hematopoiesis. Here, we investigated whether hyperactivation of mTOR in HSCs contributes to hematopoietic defects in autoimmunity and inflammation. We found that in mice deficient in Foxp3 (scurfy mice), a model of autoimmunity, the development of autoimmune disease correlated with progressive bone marrow loss and impaired regenerative capacity of HSCs in competitive bone marrow transplantation. Similarly, LPS-mediated inflammation in C57BL/6 mice led to massive bone marrow cell death and impaired HSC function. Importantly, treatment with rapamycin in both models corrected bone marrow hypocellularity and partially restored hematopoietic activity. In cultured mouse bone marrow cells, treatment with either of the inflammatory cytokines IL-6 or TNF-α was sufficient to activate mTOR, while preventing mTOR activation in vivo required simultaneous inhibition of CCL2, IL-6, and TNF-α. These data strongly suggest that mTOR activation in HSCs by inflammatory cytokines underlies defective hematopoiesis in autoimmune disease and inflammation.


Figures

Figure 1
Figure 1. Progressive bone marrow hypocellularity and HSC defects in the scurfy mice.
(A) Bone marrow cellularities of scurfy mice and their littermate controls at days 7, 14, 21, and 28 after birth. Data shown are mean ± SD (n = 4). The absolute number of bone marrow cells in scurfy and WT mice (left) and those after normalization against body weight (right) are shown. (B) HSC frequency (left) and numbers (right) in scurfy mice. Data shown are the percentage of Flk2linSca-1+c-kit+CD34CD150+CD48 cells in bone marrow of scurfy mice and their littermate controls at days 7, 21, and 28 (mean ± SD). Each time point involves 3–5 mice per group. (C) Hyperproliferation of HSCs in day 21 scurfy (sf) mice. BrdU was labeled in vivo for 24 hours and LSK cells and HSCs were stained with BrdU antibodies. Representative histograms of BrdU staining in gated LSK cell and HSC populations and the percentage of BrdU+ population are shown. Numbers indicate the percentage of BrdU+ cells. WBM, whole bone marrow cells. Data shown are mean ± SD (n = 4). (D) Diagram of competitive bone marrow transplantation (BMT). At days 7, 21, and 28, 5 × 10⁵ bone marrow cells from scurfy mice or those from their littermate controls were mixed with equal number of recipient-type bone marrow cells and transplanted into lethally irradiated CD45.1 C57BL/6 recipients. (E) Representative profiles of recipient peripheral blood from 28-day-old donors, evaluated at 12 weeks after reconstitution. Numbers indicate the percentage of donor-derived cells (CD45.2+, right bottom quadrants) or recipient-derived cells (CD45.1+, left top quadrants) in peripheral blood of recipient mice. (F) Reconstitution ratios in the recipient peripheral blood by the donor cells were monitored at 4 and 12 weeks after transplant. (G) Defective reconstitution in both myeloid (M) (CD11b+) and lymphoid lineages (B220+ for B cells and CD3+ for T cells). The bone marrow used are from 28-day-old mice. Data shown in F and G are mean ± SD (n = 10) from 2 independent experiments, involving 1 donor and 5 recipients per group. *P < 0.05; **P < 0.01; ***P < 0.001.
Figure 2
Figure 2. HSC and progenitor cell defects in the scurfy mice.
Frequencies and numbers of stem and progenitor cells in bone marrow (AC) and spleen (D and E) of the 4-week-old WT mice and scurfy littermates. Representative FACS profiles are presented in A and D, while summary data are shown in B, C, and E. The percentages of cells are shown in top panels, while the cell numbers are presented in the lower panels. Numbers indicate the percentage of the gated cells in (A) total bone marrow or (D) spleen. Data shown are mean ± SD (n = 4). *P < 0.05; **P < 0.01; ***P < 0.001.
Figure 3
Figure 3. LPS causes pancytopenia, bone marrow hypocellularity, and loss of HSC function.
(A) Diagram of experimental outline. (B) Short-term LPS treatment induces pancytopenia. Blood cell counts were measured by CBC test at indicated time points after treatment. Data shown are normalized CBC results of PBS- or LPS-treated mice at 1 week (top) or 10 weeks (bottom) after treatment. NEs, neutrophils; LYs, lymphocytes; PLTs, platelets. Mean ± SD; n = 10. (C) Bone marrow hypercellularity after LPS treatment. Data shown are (mean ± SD) numbers of bone marrow cells at 1 week after the first LPS treatment (n = 5). (D) LPS induced massive cell death in bone marrow. Data shown are representative histograms of DAPI staining. Numbers indicate the percentage of DAPI+ cells. (EG) LPS treatment impaired the long-term reconstitution capacity of HSCs. (E) Representative profiles of donor-type (CD45.2) and recipient-type (CD45.1) blood cells 15 weeks after transplantation. Profiles depicting reconstitution of peripheral blood after transplantation with total bone marrow cells (left) and shows those reconstituted with purified HSCs (right) are shown. Numbers indicate the percentage of donor-derived cells (CD45.2+, left top quadrants) or recipient-derived cells (CD45.1+, right lower quadrants) in peripheral blood of recipient mice. (F) 5 × 10⁵ bone marrow cells from PBS- or LPS-treated mice were mixed with equal numbers of recipient-type bone marrow cells and were transplanted into lethally irradiated CD45.1 C57BL/6 recipients. Summary data at each time point are shown (mean ± SD). (G) Fifty FACS-sorted HSCs were mixed with 100,000 recipient-type bone marrow cells. Reconstitution ratios in recipient peripheral blood by the donor cells were monitored at indicated time points after transplant. Total, all leukocytes; B, B220+ B lymphocytes; T, CD3+ T lymphocytes; M, CD11b+ myeloid cells. Data shown are mean ± SD (n = 10). *P < 0.05; **P < 0.01; ***P < 0.001.
Figure 4
Figure 4. IL-6, TNF-α, and CCL2 are responsible for hematopoietic defects in LPS-treated mice.
(A) The cytokine levels in the plasma of PBS- or LPS-treated mice at 2 or 72 hours after treatment (mean ± SD). (B) Diagram of experimental design. Six- to eight-week-old WT or Ccr2–/– mice receive LPS on days 0 and 3 (0.3 mg per mice). At both time points, the WT mice also received control mouse IgG, whereas the Ccr2–/– mice received equal amounts of mAbs specific for TNF-α and IL-6, respectively. Mice were analyzed on day 0, 3, and 7. aIL-6, anti–IL-6; aTNF-α, anti–TNF-α. (C) Involvement of inflammatory cytokines in bone marrow hypocellularity. Data shown are (mean ± SD) bone marrow cell numbers (n = 4). (D) The frequency (top) and absolute numbers (bottom) of HSCs in bone marrow after LPS treatment and cytokine blockade. WT mice were treated with control Ig, while Ccr2–/– mice received anti–IL-6 and anti-TNF-α mAbs. Mean ± SD. (E) Effect of cytokine blockade on apoptosis of HSCs at day 7. Data shown are FACS plots of DAPI and Annexin V staining and represent data from 4 mice per group. Numbers indicate the percentage of apoptotic (Annexin V+ DAPI) and dead (Annexin V+ DAPI+) cells. (F) Role for inflammatory cytokines in LPS-induced HSC defects. WT or anti–IL-6 and anti–TNF-α–treated Ccr2–/– mice were treated with PBS or LPS twice. Four days after the second treatment, 5 × 10⁵ bone marrow cells were mixed with equal numbers of recipient-type (CD45.1) bone marrow cells and were transplanted into lethally irradiated CD45.1 C57BL/6 recipients. Reconstitution ratios in the recipient peripheral blood by the donor cells were monitored at 4, 8, and 12 weeks after transplantation. Data shown are mean ± SD (n = 10). *P < 0.05; **P < 0.01; ***P < 0.001.
Figure 5
Figure 5. IL-6 and TNF-α activate the mTOR pathway in HSCs.
c-kit+ bone marrow cells were isolated from 2- to 3-month-old WT C57BL/6 mice and cultured with or without IL-6 or TNF-α for 30 minutes. mTOR activity was measured in the total c-kit+ bone marrow cells by the level of pS6K using Western blot (A) and in the LSK cells and HSC populations using flow cytometry (B). The data have been repeated in 3 independent experiments.
Figure 6
Figure 6. An essential role for inflammatory cytokines in mTOR activation in HSCs.
(AD) LPS induces phosphorylation of mTOR and S6 proteins. C57BL/6 mice were treated with PBS (control) or 0.3 mg LPS. Two hours after treatment, bone marrow cells were harvested and the levels of phosphorylated mTOR (A and B) and phosphorylated S6 (C and D) in whole bone marrow cells, LSK cells, and HSCs were measured by flow cytometry. (A and C) Representative FACS profiles. Solid lines depict fluorescence of samples stained with either anti-pmTOR (A) or pS6 (C), while the dotted lines depict those of isotype control-stained samples. Number indicate (A) the percentage of pmTOR+ cells and (C) the percentage of pS6+ cells. (B and D) Summary data of levels of pmTOR (B) and pS6 (D). (E and F) Inflammatory cytokines are essential for mTOR activation in LSK cells and HSCs. (E) Representative histograms. (F) Summary data involving 5 mice per group. Data shown in B, D, and F are mean ± SD of the mean fluorescence intensity. n = 5. *P < 0.05; ***P < 0.001.
Figure 7
Figure 7. Rapamycin rescues LPS-induced defects in bone marrow.
(A) Diagram of experimental design. Mice that received LPS on days 0 and 3 were treated with either vehicle (veh) or rapamycin (rapa) on days –1, 0, 2, and 3. Bone marrow cells were analyzed on day 7. (B) Rapamycin did not reduce levels of inflammatory cytokines in the plasma. Data shown are mean ± SD of plasma levels of IL-6, TNF-α, and CCL2 at 2 hours after LPS treatment (n = 5). Mice in the “Neg” group received PBS. Mice in the vehicle or rapamycin groups received LPS with either vehicle or rapamycin treatment. (C) Rapamycin prevented LPS-induced bone marrow hypocellularity. Data shown are mean ± SD of the number of bone marrow cells (n = 5). Mice in the “w/o” or LPS groups received PBS or LPS and were treated with vehicle. Mice in the rapamycin and rapamycin plus LPS groups received PBS or LPS and were treated with rapamycin. (D) Rapamycin prevented apoptosis of bone marrow cells induced by LPS. Data shown are representative FACS profiles of an experiment involving 5 mice per group. Numbers indicate the percentage of gated cells in bone marrow. (E) Inhibition of mTOR by rapamycin prevented LPS-induced loss of HSC function. 5 × 10⁵ bone marrow cells, mixed with equal number of recipient-type bone marrow cells, were transplanted into lethally irradiated CD45.1 C57BL/6 recipients. Reconstitution ratios in the recipient peripheral blood by the donor cells were monitored at indicated time points after transplant. M, Mac-1+ myeloid cells. Data shown are mean ± SD (n = 10). *P < 0.05; **P < 0.01; ***P < 0.001.
Figure 8
Figure 8. Hyperactivity of mTOR in HSCs causes defective hematopoiesis in the scurfy mice.
(A) Hyperactivation of the mTOR pathway in HSCs. Bone marrow cells from 3-week-old scurfy mice and their littermate controls were stained with antibodies specific for phosphorylated mTOR and phosphorylated S6. Data shown are representative histograms from 2 independent experiments, each involving 2 mice per group. (BG) Rapamycin treatment increased lifespan, reduced abnormalities in hematopoiesis, and restored HSC function in the scurfy mice. (B) Diagram of experiments. The 2-week-old scurfy mice were treated for either 1 (survival analysis) or 2 weeks (bone marrow composition and transplantation) with rapamycin (4 mg/kg/injection, every other day). (C) Short-term rapamycin treatment substantially increased lifespan of the scurfy mice. After 1 week of treatment, the mice were left untreated for observation until they were moribund. The vehicle- and rapamycin-treated groups were compared by Kaplan-Meier survival analysis, and the statistical significance was determined by log-rank test (mean ± SD; n = 8 for the vehicle group and n = 6 for the rapamycin group). (DG) Rapamycin treatment partially restored bone marrow cellularity (D), B and myeloid cells (E), and erythroid lineage (F) development in bone marrow. Data in DG are mean ± SD (n = 3). (G) Short-term rapamycin treatment in the scurfy mice increased their HSC function. Data shown are the percentage of CD45.2+ donor (scurfy) bone marrow–derived cells in the peripheral blood at various time points after bone marrow transplantation. Data shown are mean ± SD (n = 15) from 3 independent donors per group. *P < 0.05; **P < 0.01; ***P < 0.001.

Comment in

References

    1. Inoki K, Corradetti MN, Guan KL. Dysregulation of the TSC-mTOR pathway in human disease. Nat Genet. 2005;37(1):19–24. doi: 10.1038/ng1494. - DOI - PubMed
    1. Inoki K, Guan KL. Complexity of the TOR signaling network. Trends Cell Biol. 2006;16(4):206–212. doi: 10.1016/j.tcb.2006.02.002. - DOI - PubMed
    1. Yilmaz OH, et al. Pten dependence distinguishes haematopoietic stem cells from leukaemia-initiating cells. Nature. 2006;441(7092):475–482. doi: 10.1038/nature04703. - DOI - PubMed
    1. Zhang J, et al. PTEN maintains haematopoietic stem cells and acts in lineage choice and leukaemia prevention. Nature. 2006;441(7092):518–522. doi: 10.1038/nature04747. - DOI - PubMed
    1. Chen C, Liu Y, Liu R, Ikenoue T, Guan KL, Zheng P. TSC-mTOR maintains quiescence and function of hematopoietic stem cells by repressing mitochondrial biogenesis and reactive oxygen species. J Exp Med. 2008;205(10):2397–2408. doi: 10.1084/jem.20081297. - DOI - PMC - PubMed

Publication types

MeSH terms