. 2010 Nov;120(11):3923-39.
doi: 10.1172/JCI43552. Epub 2010 Oct 25.

hnRNP L regulates the tumorigenic capacity of lung cancer xenografts in mice via caspase-9 pre-mRNA processing

Affiliations

hnRNP L regulates the tumorigenic capacity of lung cancer xenografts in mice via caspase-9 pre-mRNA processing

Rachel Wilson Goehe et al. J Clin Invest. 2010 Nov.

Abstract

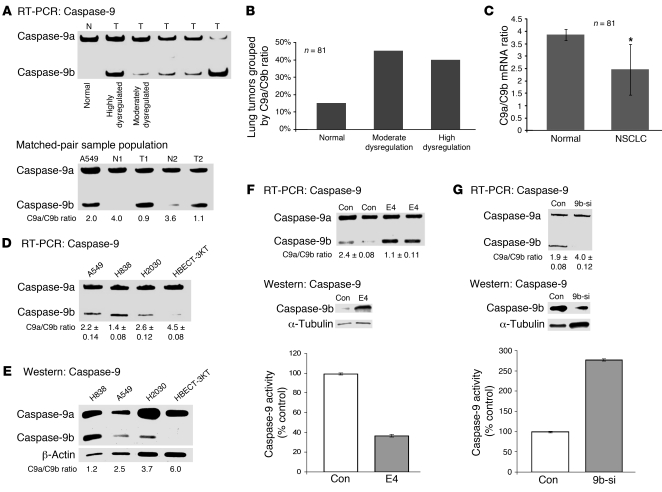
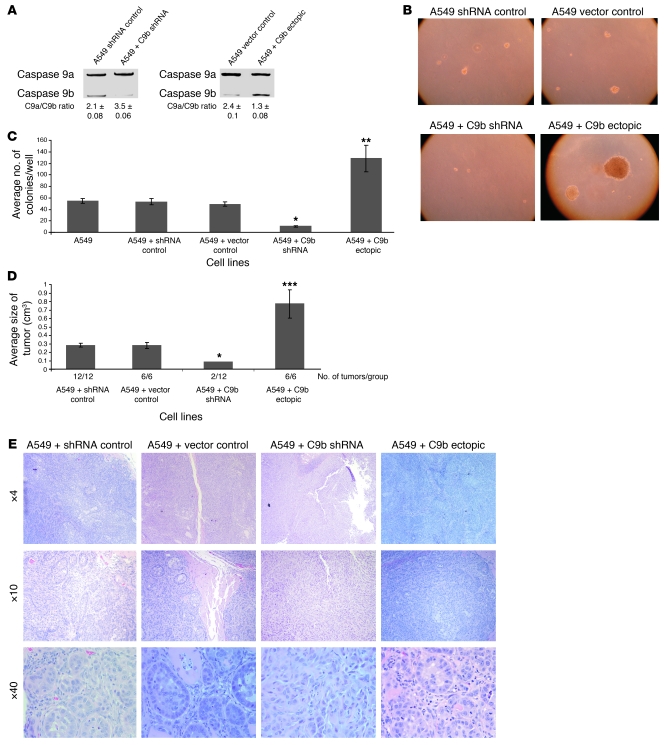
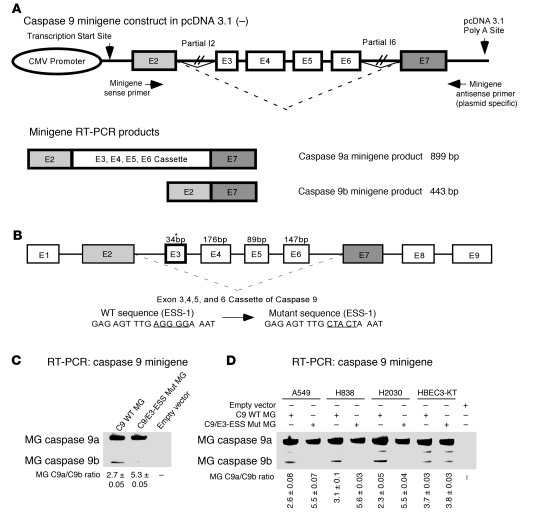
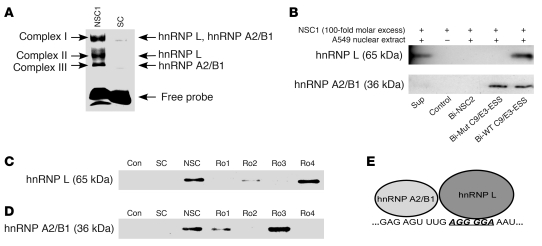
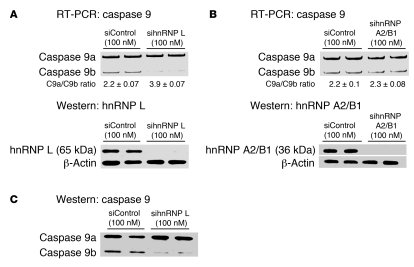
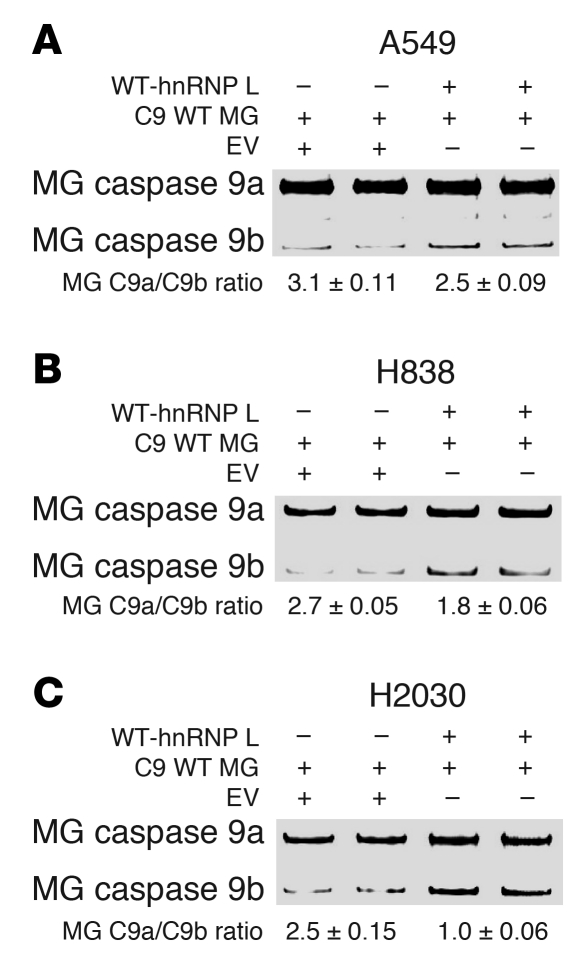
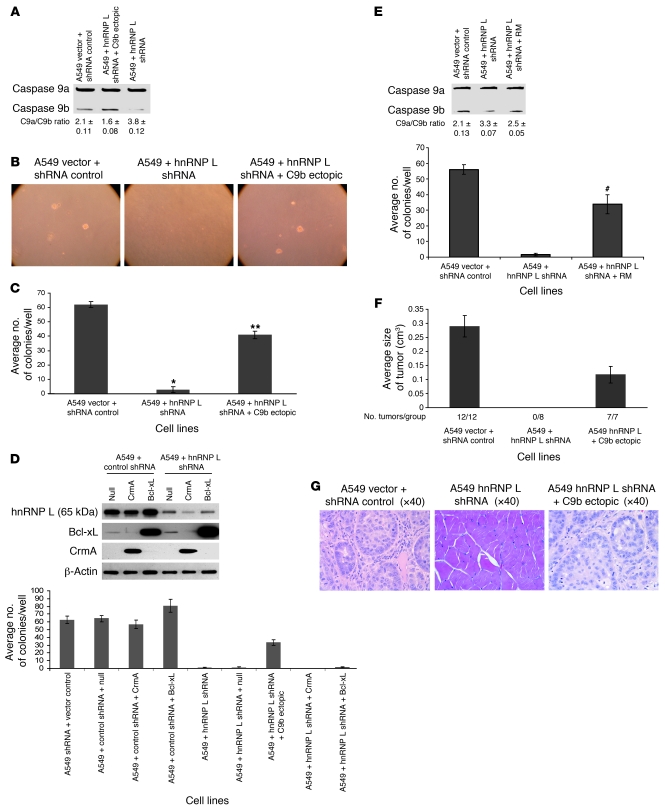
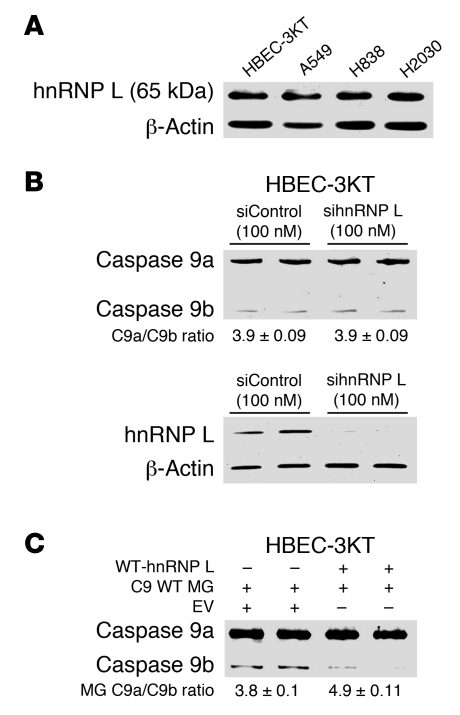
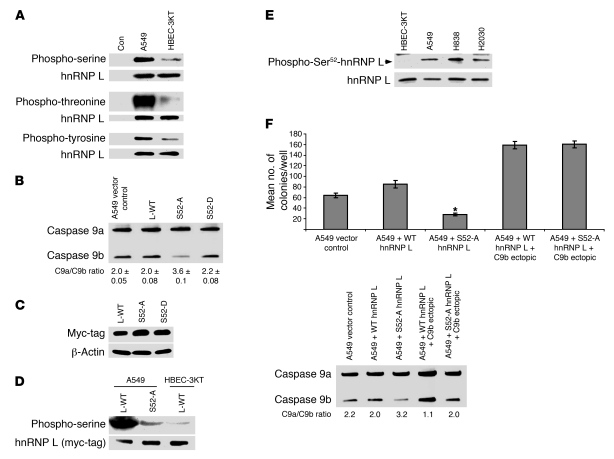
Caspase-9 is involved in the intrinsic apoptotic pathway and suggested to play a role as a tumor suppressor. Little is known about the mechanisms governing caspase-9 expression, but post-transcriptional pre-mRNA processing generates 2 splice variants from the caspase-9 gene, pro-apoptotic caspase-9a and anti-apoptotic caspase-9b. Here we demonstrate that the ratio of caspase-9 splice variants is dysregulated in non-small cell lung cancer (NSCLC) tumors. Mechanistic analysis revealed that an exonic splicing silencer (ESS) regulated caspase-9 pre-mRNA processing in NSCLC cells. Heterogeneous nuclear ribonucleoprotein L (hnRNP L) interacted with this ESS, and downregulation of hnRNP L expression induced an increase in the caspase-9a/9b ratio. Although expression of hnRNP L lowered the caspase-9a/9b ratio in NSCLC cells, expression of hnRNP L produced the opposite effect in non-transformed cells, suggesting a post-translational modification specific for NSCLC cells. Indeed, Ser52 was identified as a critical modification regulating the caspase-9a/9b ratio. Importantly, in a mouse xenograft model, downregulation of hnRNP L in NSCLC cells induced a complete loss of tumorigenic capacity that was due to the changes in caspase-9 pre-mRNA processing. This study therefore identifies a cancer-specific mechanism of hnRNP L phosphorylation and subsequent lowering of the caspase-9a/9b ratio, which is required for the tumorigenic capacity of NSCLC cells.


Figures

Figure 1
Figure 1. Caspase-9a/9b ratio is dysregulated in lung adenocarcinoma tumors and transformed lung epithelial cells.
(A) Top: A sample population of cDNAs from pathologist-verified lung adenocarcinomas, which underwent quantitative/competitive PCR for caspase-9 splice variants. Bottom: The figure depicts a sample of the matched pair analysis. N, normal tissue; T, tumor tissue. (B) The percentage of lung tumors grouped by caspase-9a/9b mRNA ratio. (C) Human lung tumor samples directly compared with normal lung tissues. *P < 0.05, Student’s t test. (D and E) The caspase-9 splicing ratio observed in non-transformed HBEC-3KT cells versus NSCLC cell lines at the RNA (D) and protein level (E). Data are n = 3 on 2 separate occasions. (F and G) Top: Quantitative/competitive RT-PCR for caspase-9 splice variants from A549 cells treated with E4 ASRO (E4) or control (Con) ASRO (F) or control siRNA or siRNA against caspase-9b (9b-si) (G). Protein samples from simultaneous experiments were subjected to SDS-PAGE and Western immunoblotted (caspase-9b, α-tubulin). Bottom: Caspase-9 activity (LEHD) in the lysates of A549 cells treated with control ASRO and E4 ASRO. Caspase-9 activity (LEHD) was calculated as relative fluorescent units (RFU) per total protein (mg) and is represented as a percentage of control cells. The data presented in F and G are expressed as mean ± SEM and are n = 4 on 3 separate occasions.
Figure 2
Figure 2. Caspase-9 regulates the tumorigenic capacity in A549 cells.
(A) Total RNA was isolated from the listed clonal cell lines and analyzed by competitive/quantitative RT-PCR for caspase-9 splice variants. (B) Cells (2 × 10³) were plated into 6-well dishes in soft agar and cultured for 14 days before the colony count. (C) Quantization (mean) of the number of colonies for the indicated clonal cell lines. n = 6. Data are mean ± SEM. *P < 0.005, A549 + shRNA control versus A549 + C9b shRNA; **P < 0.001, A549 + vector control versus A549 + C9b ectopic; Student’s t test. (D) Cell lines in A were injected into SCID mice (5 × 10⁶), and tumor volume was measured at the end of 28 days as represented as average size of tumor (cm3). Data are mean ± SEM. *P < 0.05, A549 + control shRNA versus A549 + C9b shRNA; ***P < 0.005, A549 + vector control versus A549 + C9b ectopic Student’s t test. (E) H&E stain of the tumors presented in D with magnification ranging from ×4 to ×40.
Figure 3
Figure 3. Identification of an exonic splicing silencer in exon 3 of caspase-9 pre-mRNA.
(A) Schematic of the functional minigene construct for caspase-9 constructed in pcDNA 3.1 zeocin with arrows indicating the location of primers used in the RT-PCR assay. (B) Schematic representation of the exonic splicing silencer (C9/E3-ESS) located in exon 3 of the caspase-9 gene. Asterisk indicates the location of the C9/E3-ESS purine-rich sequence. This figure also depicts the wild-type and mutagenic sequence of the C9/E3-ESS utilized in C and D. (C and D) A549, H838, H2030, and HBEC-3KT cells were transfected with the pcDNA 3.1 zeocin plasmid containing the caspase-9 minigene (C9 WT MG) (1 μg), exon 3 mutant mini­gene (E3 Mut MG) (1 μg), or empty vector control (1 μg) for 24 hours. Total RNA was extracted and analyzed by competitive/quantitative RT-PCR for the ratio of minigene caspase-9a/9b mRNA. Data are n = 4 from 2 separate occasions.
Figure 4
Figure 4. hnRNP L binds specifically to the exon splicing silencer in exon 3 of caspase-9.
(A) A 5′ FITC-tagged RO corresponding to the purine-rich sequences in exon 3 of caspase-9 was incubated in the presence of nuclear extract from A549 cells or IgG (control) and subjected to EMSAs. NSC1 or SC ROs were also added (100-fold molar excess) as indicated. Arrows indicate the 3 specific RNA-protein complexes. The RNA-protein complexes (complexes I, II, and III) were also subjected to nano-LC-MS/MS analysis. The RNA trans-factors depicted obtained x-corr values greater than 20. (B) A 5′ biotinylated wild-type C9/E3-ESS RO (Bio-C9/E3-ESS), 5′ biotinylated mutant ROs (Bio-Mut C9/E3-ESS), or a 5′ biotinylated nonspecific RO (Bio-NSC2) were incubated in the presence of nuclear extract from A549 cells or IgG (control), subjected to SDS-PAGE and Western immuno­blotting analysis (anti-hnRNP L antibody; anti-hnRNP A2/B1 antibody). Unlabeled nonspecific ROs (e.g., NSC1) at a 100-fold molar excess were also added to the reactions as indicated. The corresponding supernatant from the Bio-WT C9/E3-ESS (Sup) shows the remaining RNA trans-factor after affinity purification. (C and D) The experiments in B were repeated, but with the addition (100-fold molar excess) of either unlabeled NSC1, unlabeled competitor ROs (RO1–RO4) or unlabeled SC, as indicated. Data in Figure 4 are n = 4 on 2 separate occasions. (E) A cartoon schematic indicating the locations of the hnRNP L and hnRNP A2/B1 interactions with exon 3 of caspase-9 pre-mRNA.
Figure 5
Figure 5. Downregulation of hnRNP L, but not hnRNP A2/B1, increases the ratio of caspase-9a/9b mRNA.
A549 cells were transfected with control siRNA (100 nM), hnRNP L SMARTpool siRNA (100 nM), or hnRNP A2/B1 SMARTpool siRNA (100 nM) for 48 hours. Total RNA was isolated and analyzed by competitive/quantitative RT-PCR for caspase-9 splice variants. (A and B) hnRNP L siRNA (A) and hnRNP A2/B1 siRNA (B). Simultaneously, total protein lysates were also produced, subjected to SDS-PAGE analysis, and immunoblotted for hnRNP L, hnRNP A2/B1, caspase-9, and β-actin. (C) Results from the same Western blot membrane depicted in A. Data are n = 4 on 2 separate occasions.
Figure 6
Figure 6. Low ectopic expression of hnRNP L decreases the caspase-9a/9b splicing ratio.
(A) A549, (B) H838, and (C) H2030 cell lines were transfected with wild-type hnRNP L (WT-hnRNP L) (0.25 μg) in conjunction with caspase-9 minigene (C9 WT MG) (0.25 μg) or with caspase-9 minigene (C9 WT MG) (0.25 μg) in conjunction with empty vector (EV) (0.25 μg) for 24 hours. Total RNA was extracted and analyzed by competitive/quantitative RT-PCR for caspase-9 minigene splice variants. Data are n = 4 from 2 separate occasions. Note that the ratio of caspase-9a/9b minigene mRNA tended to present with a slightly higher ratio than endogenous caspase-9a/9b mRNA.
Figure 7
Figure 7. hnRNP L regulates the tumorigenic capacity in A549 cells via the alternative splicing of caspase-9.
(A) Total RNA from the designated cell lines was analyzed for caspase-9 splice variants. (B) Colony formation assays in soft agar for the designated cell lines. (C) Quantization of the number of colonies for the indicated clonal cell lines. n = 6; error bars represent SEM. *P < 0.005, **P < 0.001 versus A549 vector and shRNA control; Student’s t test. (D) Top: Total protein from the listed cell lines was subjected to SDS-PAGE analysis and immunoblotted for hnRNP L, Bcl-xL, CrmA, and β-actin. Bottom: Colony formation assays in soft agar for the cell lines shown at top. n = 9, error bars represent SD. A significant effect was observed compared with vector control cells (e.g., P < 0.005, Student’s t test). (E) Top: Total RNA from the listed clonal cell lines and analyzed for caspase-9 splice variants. Bottom: Quantization of the number of colonies for the indicated stable batch culture cell lines. n = 6; error bars represent SEM. #P < 0.05 compared with A549 + hnRNP L shRNA; Student’s t test. RM, resistant mutant. (F) The designated cell lines were injected subcutaneously into SCID mice. Tumor volume was measured at the end of 28 days. Error bars indicate SEM. (G) H&E stain of the tumors presented in D.
Figure 8
Figure 8. The role of hnRNP L in regulating the alternative splicing of caspase-9 in non-transformed human bronchial epithelial cells.
(A) Total protein lysates from A549, H838, H2030, and HBEC-3KT cell lines were subjected to SDS-PAGE analysis and immunoblotted for hnRNP L and β-actin. (B) HBEC-3KT cells were transfected with 100 nM control siRNA or 100 nM hnRNP L SMARTpool siRNA for 48 hours. Total RNA was isolated and analyzed by competitive/quantitative RT-PCR for caspase-9 splice variants. Simultaneously, protein lysates were also produced, subjected to SDS-PAGE, and immunoblotted for hnRNP L and β-actin. Data are n = 4 from 2 separate occasions. (C) HBEC-3KT cell lines were transfected with either wild-type hnRNP L (0.25 μg) in conjunction with caspase-9 minigene (0.25 μg) or caspase-9 minigene (0.25 μg) in conjunction with empty vector (0.25 μg) for 24 hours. Total RNA was extracted and analyzed by competitive/quantitative RT-PCR for caspase-9 minigene splice variants. Data are n = 3 on 2 separate occasions. Of note: the ratio of caspase-9a/9b minigene mRNA tended to present with a slightly higher ratio than endogenous caspase-9a/9b mRNA.
Figure 9
Figure 9. Ser52 of hnRNP L is hyperphosphorylated in NSCLC cells and regulates the alternative splicing of caspase-9.
(A) A549 and HBEC-3KT cell lines were seeded at the same confluency and in the same culture media 24 hours before IP. IP hnRNP L was resolved by SDS-PAGE and immunoblotted with phospho-specific and hnRNP L antibodies. (B) A549 cells were transfected with WT-hnRNP L (L-WT) (1 μg), Ser52Ala hnRNP L (S52-A) (1 μg), or Ser52Asp hnRNP L (S52-D) (1 μg). Total RNA was analyzed for caspase-9 splice variants. n = 4 from 3 occasions. (C) A549 cells were transfected with WT-hnRNP L, S52-A, or S52-D. Protein lysates were subjected to SDS-PAGE and immunoblotted for myc-tag and β-actin. Empty vector showed no expression of a myc-tagged protein. (D) A549 and HBEC-3KT cell lines seeded at the same confluency and in the same culture media for 24 hours before IP. Cell lines were transfected with WT-hnRNP L (1 μg) or S52-A (1 μg). Ectopically expressed hnRNP L was IP with c-myc tag Ab, resolved by SDS-PAGE, and immunoblotted with anti–phospho-serine and anti–c-myc tag antibodies. (E) Protein lysates were subjected to SDS-PAGE and immunoblot for phospho-Ser52 hnRNP L and hnRNP L. Phospho-Ser52 antibody for hnRNP L was validated by ELISA, hnRNP shRNA samples, and lack of identifying the Ser52Ala mutant of hnRNP L. (F) Colony formation assays in soft agar. n = 6; error bars represent SEM. *P < 0.005, A549 + S52-A hnRNP L + C9b ectopic versus A549 + S52-A hnRNP L.

Comment in

Similar articles

Cited by

References

    1. Hajra KM, Liu JR. Apoptosome dysfunction in human cancer. Apoptosis. 2004;9(6):691–704. doi: 10.1023/B:APPT.0000045786.98031.1d. - DOI - PubMed
    1. Kominsky DJ, Bickel RJ, Tyler KL. Reovirus-induced apoptosis requires both death receptor- and mitochondrial-mediated caspase-dependent pathways of cell death. Cell Death Differ. 2002;9(9):926–933. doi: 10.1038/sj.cdd.4401045. - DOI - PubMed
    1. Liang Q, et al. 6–Hydroxydopamine induces dopaminergic cell degeneration via a caspase-9–mediated apoptotic pathway that is attenuated by caspase–9dn expression. J Neurosci Res. 2004;77(5):747–761. doi: 10.1002/jnr.20198. - DOI - PubMed
    1. Philchenkov A, Zavelevich M, Kroczak TJ, Los M. Caspases and cancer: mechanisms of inactivation and new treatment modalities. Exp Oncol. 2004;26(2):82–97. - PubMed
    1. Seol DW, Billiar TR. A caspase-9 variant missing the catalytic site is an endogenous inhibitor of apoptosis. J Biol Chem. 1999;274(4):2072–2076. doi: 10.1074/jbc.274.4.2072. - DOI - PubMed

Publication types

MeSH terms