. 2010 Nov;12(11):1046-56.
doi: 10.1038/ncb2108. Epub 2010 Oct 24.

Angiocrine factors from Akt-activated endothelial cells balance self-renewal and differentiation of haematopoietic stem cells

Affiliations

Angiocrine factors from Akt-activated endothelial cells balance self-renewal and differentiation of haematopoietic stem cells

Hideki Kobayashi et al. Nat Cell Biol. 2010 Nov.

Abstract

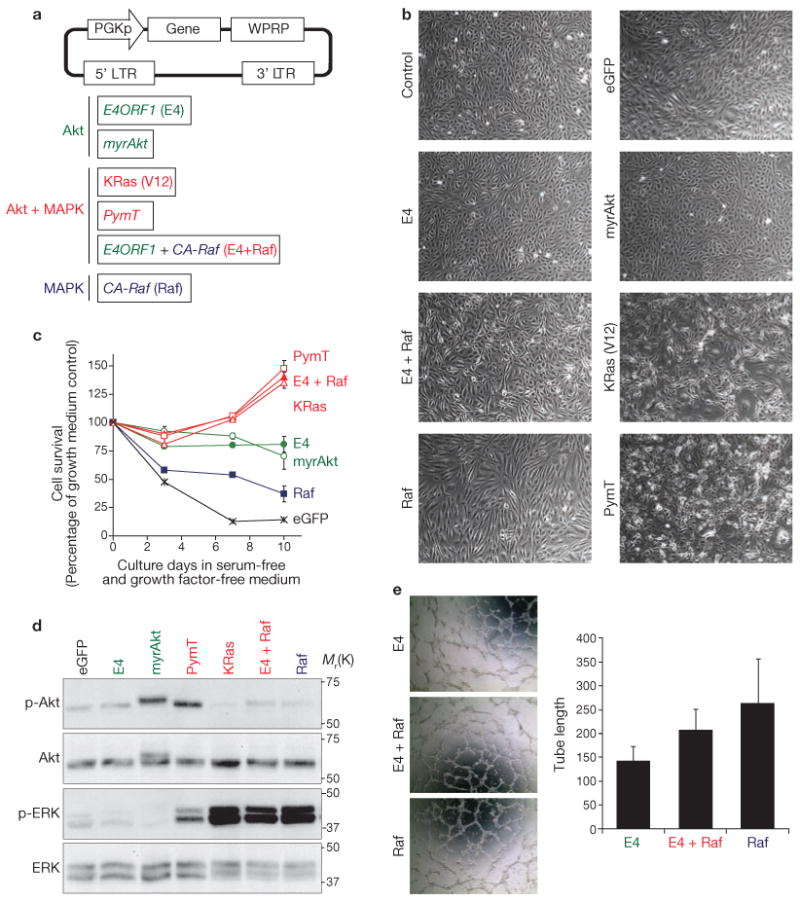
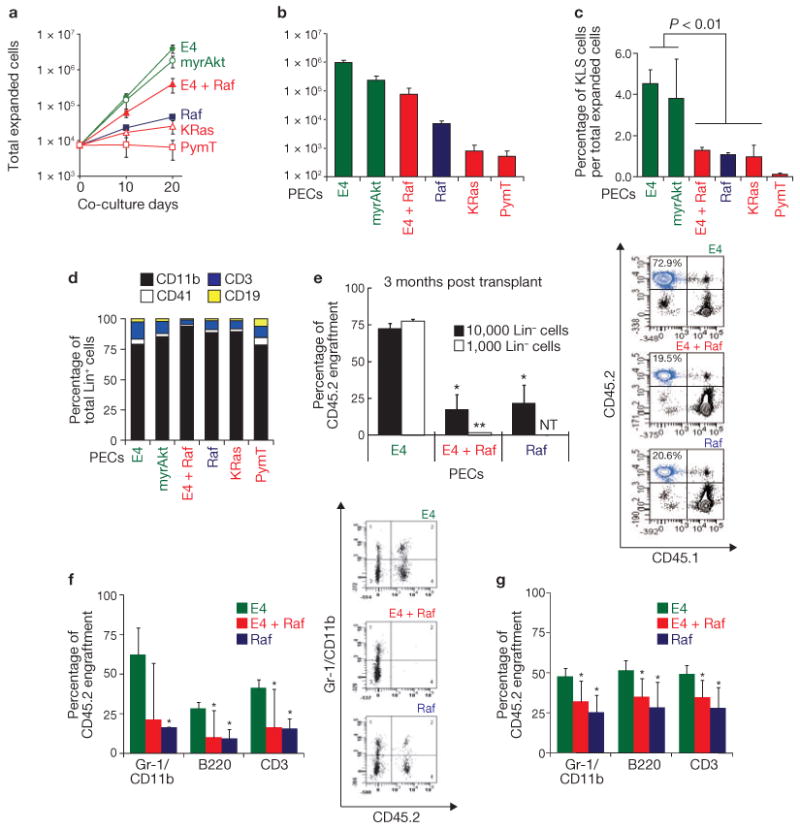
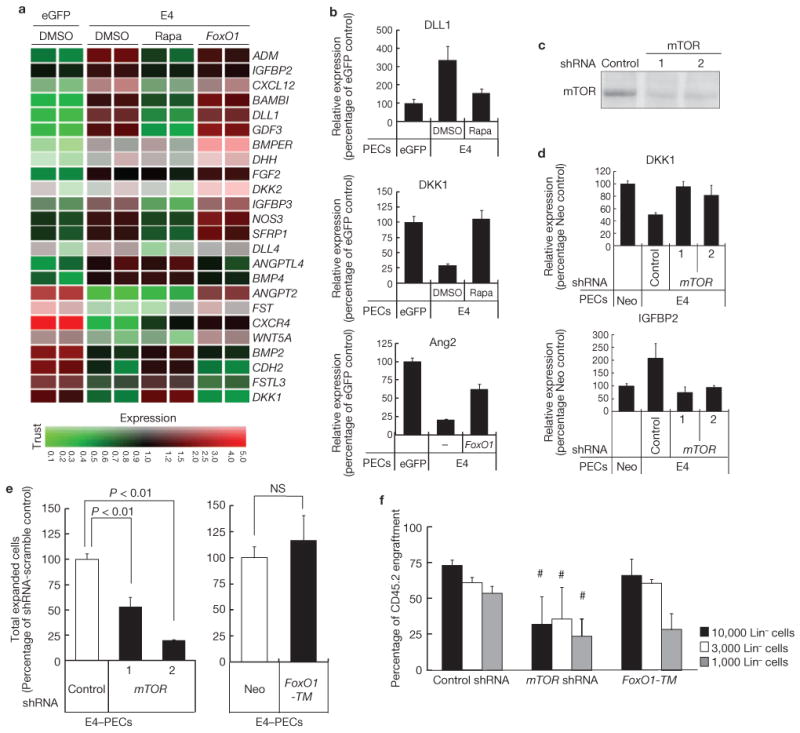
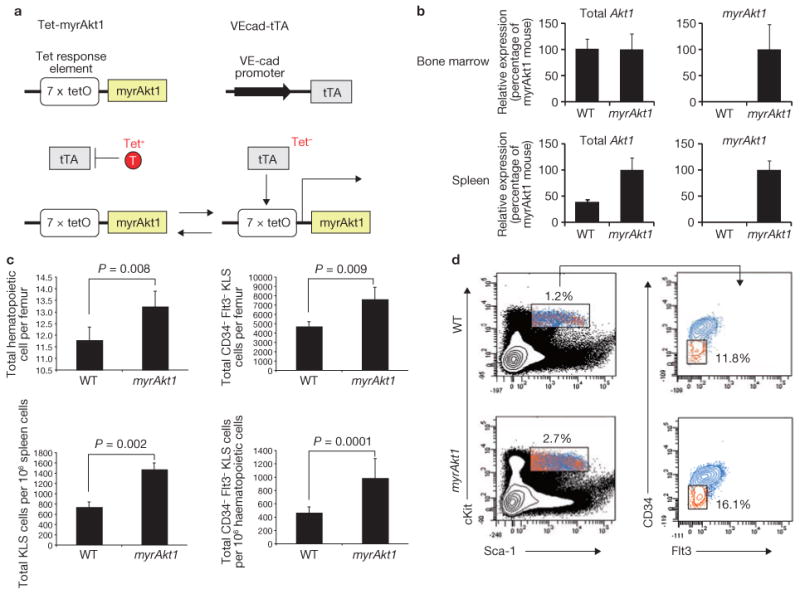
Endothelial cells establish an instructive vascular niche that reconstitutes haematopoietic stem and progenitor cells (HSPCs) through release of specific paracrine growth factors, known as angiocrine factors. However, the mechanism by which endothelial cells balance the rate of proliferation and lineage-specific differentiation of HSPCs is unknown. Here, we demonstrate that Akt activation in endothelial cells, through recruitment of mTOR, but not the FoxO pathway, upregulates specific angiocrine factors that support expansion of CD34(-)Flt3(-) KLS HSPCs with long-term haematopoietic stem cell (LT-HSC) repopulation capacity. Conversely, co-activation of Akt-stimulated endothelial cells with p42/44 MAPK shifts the balance towards maintenance and differentiation of the HSPCs. Selective activation of Akt1 in the endothelial cells of adult mice increased the number of colony forming units in the spleen and CD34(-)Flt3(-) KLS HSPCs with LT-HSC activity in the bone marrow, accelerating haematopoietic recovery. Therefore, the activation state of endothelial cells modulates reconstitution of HSPCs through the modulation of angiocrine factors, with Akt-mTOR-activated endothelial cells supporting the self-renewal of LT-HSCs and expansion of HSPCs, whereas MAPK co-activation favours maintenance and lineage-specific differentiation of HSPCs.


Conflict of interest statement

Competing Financial Interests: The authors declare no competing financial interests.

Figures

Figure 1
Figure 1
Establishment of Akt- or MAPK-activated PECs. (a) Schematic representations of the pCCL.PGK lentiviral vector (top) and genes used (bottom) for generation of Akt- and/or MAPK-activated endothelial cells. HUVECs were transduced with lentiviruses containing vectors with these genes. PECs transduced with E4ORF1 are referred as E4–PECs, PECs transduced with CA-Raf as Raf–PECs, and PECs transduced with both E4ORF1 and CA-Raf as E4 + Raf–PECs. E4–PECs and myrAkt–PECs represent Akt-activated PECs. Raf–PECs represent MAPK-activated PECs. PymT–PECs, KRas(V12)–PECs, and E4 + Raf–PECs represent PECs in which both Akt and MAPK are activated. (b) Representative phase contrast microscopy images of the indicated PECs. (c) Survival of different PECs in serum- and growth factor-free medium. Confluent cells were cultured in the serum- and growth factor-free medium for the indicated days. Data are means ± s.d. (n = 3) and are represented as a percentage of growth, compared with the eGFP-expressing control at 0 days. (d) Phosphorylation of Akt and the MAPKs, ERK1 and ERK2 (ERK), in the indicated PECs was analysed by western blotting. (e) Angiogenic activity was measured by the tube formation assay. Left: representative phase contrast microscopy images of the indicated PECs. Right: length of tubes formed by the indicated PECs. Data are means ± s.d. (n = 3). Uncropped images of blots are shown in Supplementary Information, Fig. SXX.
Figure 2
Figure 2
Akt-activated PECs are more efficient than MAPK-activated PECs in expanding HSPCs. (a) Lin cells were co-cultured on the indicated PECs over 20 days, and expansion of the Lin cells was measured. (b) Total number of CD34Flt3 KLS HSPCs after 20 days co-culture of Lin cells with the indicated PECs. Data are means ± s.d. (n = 3). (c) Percentage of KLS cell population over the total expanded haematopoietic cells (Lin and Lin+) after 10 day co-culture with the indicated PECs. Data are means ± s.d. (n = 3). (d) Composition of Lin+ cells generated after co-culture on the indicated PECs. (e) Competitive repopulation assay. Left: 10,000 or 1,000 CD45.2 Lin cells (co-cultured on E4–PECs, E4 + Raf–PECs or Raf–PECs), and 500,000 freshly prepared CD45.1 competitive whole bone marrow mononuclear cells, were transplanted into lethally irradiated mice, and percentage of engraftment by CD45.2 cells was analysed by antibody staining and FACS of peripheral blood after 3 months. Right: representative FACS dot plot of CD45.1 and CD45.2 expression in cells isolated from the blood of transplanted mice. Percentage of cells expressing CD45.2 is indicated at the top left. n.t.; not tested. Data are means ± s.d. (n = 3, asterisks indicate P < 0.05, compared with cells from mice transplanted with Lin cells co-cultured on E4–PECs). (f) Left: 10,000 CD45.2 Lin cells co-cultured on the indicated PECs, and 500,000 freshly prepared CD45.1 competitive whole bone marrow mononuclear cells, were transplanted into lethally irradiated mice, and percentage of long-term multi-lineage engraftment (4 months) by the haematopoietic cells expressing the indicated markers was assayed by FACS. Right: representative FACS dot plot of Gr-1/CD11b and CD45.2 expression of cells isolated from the blood of transplanted mice. Data are means ± s.d. (n = 3, asterisks indicate P < 0.05, compared with Gr-1/CD11b-expressing cells from mice transplanted with Lin cells co-cultured on E4–PECs). (g) Whole bone marrow mononuclear cells were isolated from mice that had been long-term engrafted (as in e) and were transplanted into lethally irradiated secondary recipients. Engraftment of cells expressing the indicated markers was quantified in the secondary recipient by FACS 8 months after transplant. Data are mean ± s.d. (n = 4, P < 0.05).
Figure 3
Figure 3
HSPC expansion on PECs requires direct cellular interaction. (a) Cell-cycle analysis of KLS cells, expanding on differentially activated PECs, cultured without PECs, or freshly purified from bone marrow (fresh BM). Data are means ± s.d. (n = 3). Right: representative plots of cell-cycle analysis of KLS cells co-cultured on the indicated PECs by FACS and treated with propidium iodide (PI) to stain DNA. (b) Colony formation assay of KLS HSPCs co-cultured on the indicated PECs over 4 and 7 days. (c) Quantification of CFU-GEMM and CFU-GM of KLS cells after 7 days co-culture with indicated PECs. (d, e) Effects of conditioned medium from different PECs on generation of Lin+ cells (d) and CD34Flt3 KLS HSPCs expansion (e). Mouse Lin cells were co-cultured with or without E4–PECs in the presence of conditioned media from E4–PECs, E4 + Raf–PECs, Raf–PECs, or control serum and growth factor-free X-vivo20 medium (vehicle) for 8 days. Data are mean ± s.d. (n = 3).
Figure 4
Figure 4
Activation state of the PECs determines the expression pattern of HSPC-active genes. (a) Hierarchical clustering, using 2,404 probe-sets, of genes that had over a 2-fold difference when comparing Akt–PECs (E4–PECs and myrAkt–PECs) and MAPK–PECs (Raf–PECs, K-Ras(V12)–PECs, and E4 + Raf–PECs). Red and green in the heatmap graphs represent higher and lower expression, compared with the median for that particular gene, as indicated in the scale on the right. Colour intensity is related to the difference with the median (black). Clustering of the different PECs is indicated on the left. (b) Change in the expression profile of representative Akt- or MAPK-regulated genes. Based on microarray results, genes statistically (P < 0.05) induced or decreased by Akt (E4 and myrAkt PECs), Akt and MAPK (E4 + Raf and K-Ras PECs), and MAPK (Raf PECs) were coloured yellow or blue, as indicated. The values indicate fold-change of expression level, compared with control eGFP+ PECs. (c, d, e) Expression of representative Akt-dominant genes (FGF2, IGFBP2 and DHH; c), MAPK-dominant genes (Ang2, IGFBP3 and IL6; d), and Notch ligands (e) in the indicated PECs were quantified by quantitative PCR. Data are mean ± s.d. (n = 3). (f–i) Expansion of CD34Flt3 KLS HSPCs on E4–PECs with knockdown of IGFBP2 (f) or FGF2 (g), and on E4 + Raf–PECs with knockdown of Jagged-1 (h) or Ang2 (i). Knockdown efficacy was confirmed by quantitative PCR (Supplementary Information, Fig. S6a). Data are means ± s.d. (n = 3, asterisk indicates P < 0.05, compared with control).
Figure 5
Figure 5
Activation of Akt-mTOR pathway in endothelial cells promotes expansion of HSPCs. (a) Effect of mTOR inhibition or FoxO1 constitutive activation in Akt–PECs on expression profile of a specific set of genes that are known to regulate HSPC fate. E4–PECs were treated with DMSO (control), 20 nM rapamycin (rapa) or transduced with a constitutively active mutant of FoxO1 (FoxO1-TM). Total RNA was used for Affymetrix microarray gene-chip analysis. Specific genes, which were regulated by Akt activation were listed and presented in the heatmap. Red and green in the heatmap graphs represent higher and lower expression, compared with the median calculated from the intensity values for that particular gene from all the treatments, as indicated in the scale at the bottom. Colour intensity is related to the difference with the median (black). (b) Microarray results of E4–PECs treated with rapamycin or overexpressing FoxO1-TM were confirmed by quantitative PCR. Result of representative mTOR-dependent (DLL1 and DKK1) and FoxO1-dependent (Ang2) genes are shown. Data are means ± s.d. (n = 3). (c) mTOR knockdown by transfection with two different shRNA was confirmed by western blotting. (d) Gene expression change of mTOR-regulated genes DKK1 (top) and IGFBP2 (bottom) in mTOR knockdown E4–PECs. Data are means ± s.d. (n = 3). (e) Expansion of CD34Flt3 KLS HSPCs when co-cultured on mTOR-knockdown (left) or FoxO1-TM-overexpressing (right) E4–PECs. Data are means ± s.d. (n = 3). (f) Competitive repopulation assay. CD45.2 Lin cells (10,000, 3,000 or 1,000), cultured on E4–PECs transduced with control scrambled-sequence shRNA, mTOR shRNA or transduced with FoxO1-TM, were transplanted with 200,000 freshly prepared CD45.1 competitive whole bone marrow mononuclear cells into lethally irradiated mice and peripheral blood was analysed after 3 months. Asterisk indicates P < 0.05, compared with E4–PECs transduced with control scrambled-sequence shRNA. Data are means ± s.d. (n = 3). Uncropped images of blots are shown in Supplementary Information, Fig. SXX.
Figure 6
Figure 6
Endothelial-specific expression of constitutively active Akt1 (myrAkt) in the adult mice augments HSPC generation and accelerates haematopoiesis. (a) Schematic representation of the tetracycline-off expression system used in adult mice to control expression of constitutively active Akt1 in an endothelial-cell-specific manner. Top: myrAkt1 transcription is controlled by a tetracycline-responsive element promoter complex (left). An endothelial-cell-specific VE-cadherin promoter drives the expression of the tetracycline-transactivator (right). Bottom: addition (left) or removal (right) of tetracycline can be used to control expression of myrAkt1. (b) Total endogenous Akt1 (left) and specifically myrAkt1 transgene (right) expression were quantified and compared by quantitative PCR in the whole bone marrow (top) or spleen (bottom) of wild-type mice or VEcad-tTA/Tet-myrAkt1 mice after withdrawal of tetracycline from. For Akt1 detection primer sets recognize endogenous Akt1 and myrAkt1, whereas for myrAkt1 detection, primer sets that only recognize the myrAkt1 transgene were used. Data are means ± s.d. (n = 4). (c) Bone marrow cells from whole femurs and spleens of wild-type and VEcad-tTA/Tet-myrAkt1 mice were analysed at steady state for absolute numbers of haematopoietic cells (top left) and CD34Flt3 KLS HSPCs (top right). The ratio of KLS cells per 106 spleen cells (bottom left) and CD34Flt3 KLS HSPCs per 106 bone marrow cells (bottom right) was also analysed. Data are means ± s.d. (n = 5). (d) Representative FACS dot plots used for quantification of cells from wild-type mice (top) and VEcad-tTA/Tet-myrAkt1 mice (bottom) in c. Left: identification of haematopoietic cells. Percentage of haematopoietic cells is indicated. Right: haematopoietic cells were analysed further by FACS to identify CD34Flt3 cells. Percentage of CD34Flt3 cells is indicated.
Figure 7
Figure 7
Akt-activated endothelial cells support expansion of short- and long-term repopulating HSCs in adult mice. (a) Lethally irradiated wild-type FVB mice were transplanted with 500,000 whole bone marrow mononuclear cells, from wild-type mice (WT) or VEcad-tTA/Tet-myrAkt1 mice overexpressing myrAkt1. Ten days after transplant, peripheral blood was analysed for recovery of the level of white blood cells (left), red blood cells (middle) and platelets. Data are means ± s.d. (n = 5). (b) The spleens of mice overexpressing myrAkt1 were analysed for spleen colony forming units (CFU-S). Data are means ± s.d. (n = 5). (c) Competitive transplantation assays. FVB mice were lethally irradiated. These mice then received a transplant of whole bone marrow cells, harvested from wild-type mice or VEcad-tTA/Tet-myrAkt1 mice overexpressing myrAkt1, along with competitive whole bone marrow cells from a FVB mouse expressing GFP. After three months, CD45+GFP cells were quantified from the total engrafted cells in peripheral blood. (d) Representative FACS dot plots used to quantify cells in c. The percentage of cells that are CD45+ and GFP is indicated in the top left. (e) Identification and quantification of the indicated engrafted cells in peripheral blood samples from lethally irradiated mice transplanted with whole bone marrow cells from mice overexpressing myrAkt1, three months after transplant. (f) Representative FACS dot plots used to quantify cells in e. (g) Proposed model for HSPC homeostasis by the vascular niche demonstrating that the activation status of the endothelial cells balances the expansion and differentiation of HSPCs. Akt-activated PECs (middle) mainly promote HSPC maintenance and regeneration through production of prototypical HSPC-active angiocrine growth factors, including IGFBP2, FGF2, DHH and BMP4, and downregulation of HSPC inhibitory factors, such as DKK1 and Ang2. Conversely, downregulation of IGFBP2 and FGF2 (right), as well as upregulation of maturation factors, such as IL6 in MAPK-activated PECs, favours differentiation of HSPCs. However, in both Akt- and MAPK-activated PECs (left), expression of various Notch ligands support long-term maintenance of the HSPC, preventing excessive exhaustion of the HSPCs. The extent of Akt- and MAPK-activation through stimulation by angiogenic growth factors might determine the homeostasis of HSPCs.

Comment in

  • HSPCs in the balance: The vascular niche.
    Boyerinas B, Sipkins DA. Boyerinas B, et al. Cell Stem Cell. 2010 Dec 3;7(6):645-6. doi: 10.1016/j.stem.2010.11.021. Cell Stem Cell. 2010. PMID: 21112557 No abstract available.

Similar articles

Cited by

References

    1. Zhang J, et al. Identification of the haematopoietic stem cell niche and control of the niche size. Nature. 2003;425:836–841. - PubMed
    1. Calvi LM, et al. Osteoblastic cells regulate the haematopoietic stem cell niche. Nature. 2003;425:841–846. - PubMed
    1. Kollet O, et al. Osteoclasts degrade endosteal components and promote mobilization of hematopoietic progenitor cells. Nat Med. 2006;12:657–664. - PubMed
    1. Scadden DT. The stem-cell niche as an entity of action. Nature. 2006;441:1075–1079. - PubMed
    1. Kiel MJ, Morrison SJ. Uncertainty in the niches that maintain haematopoietic stem cells. Nat Rev Immunol. 2008;8:290–301. - PubMed

Publication types

MeSH terms

Substances