. 2010 Nov;12(11):1115-22.
doi: 10.1038/ncb2117. Epub 2010 Oct 24.

Primary cilia regulate mTORC1 activity and cell size through Lkb1

Affiliations

Primary cilia regulate mTORC1 activity and cell size through Lkb1

Christopher Boehlke et al. Nat Cell Biol. 2010 Nov.

Abstract

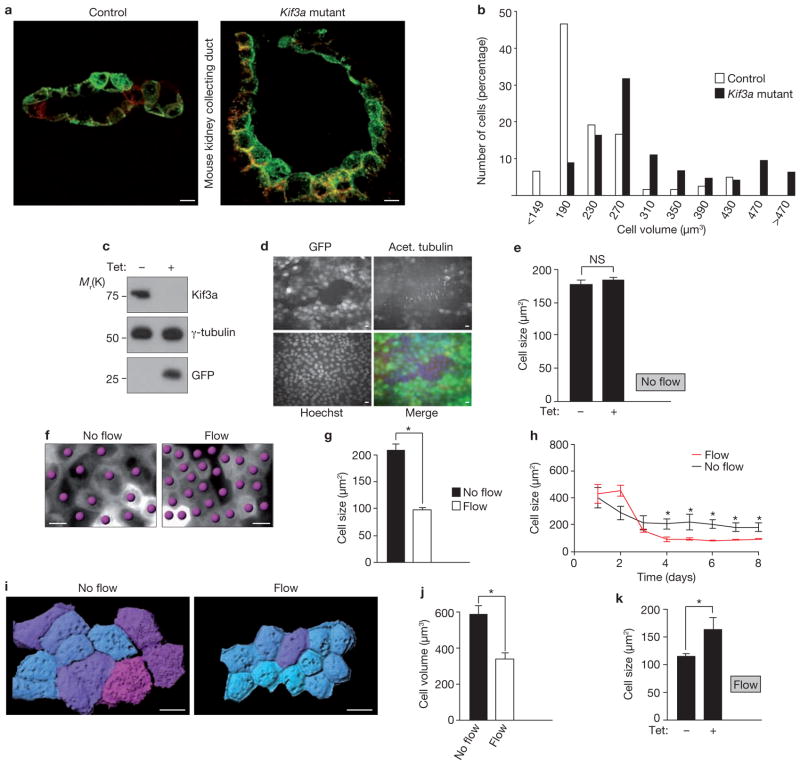
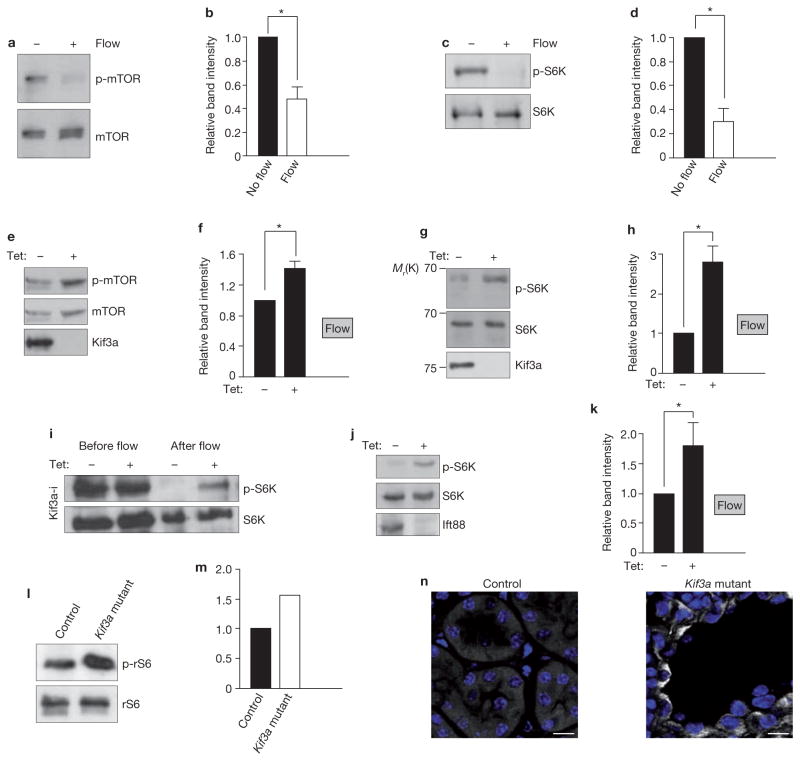
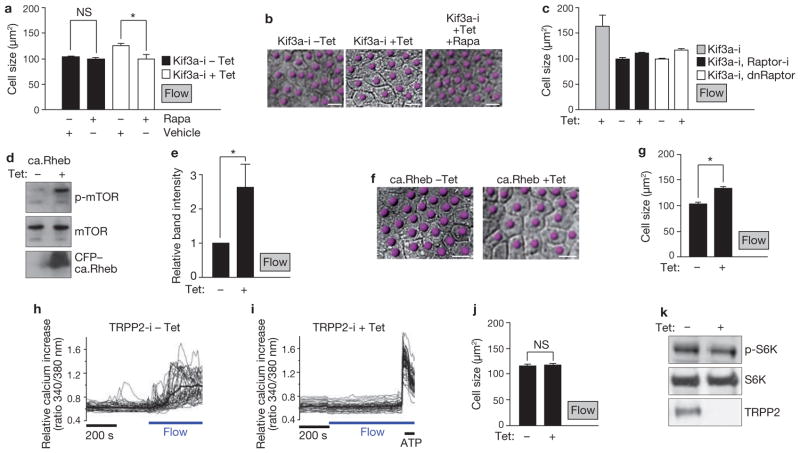
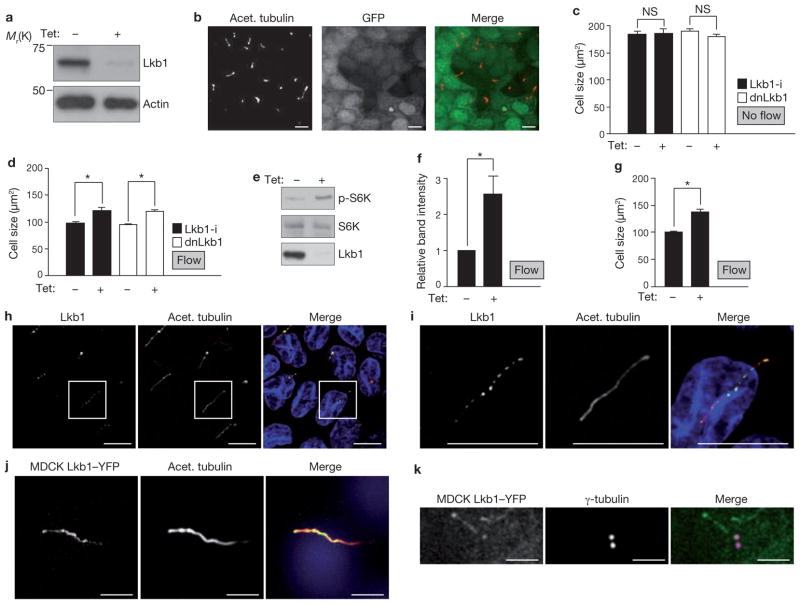
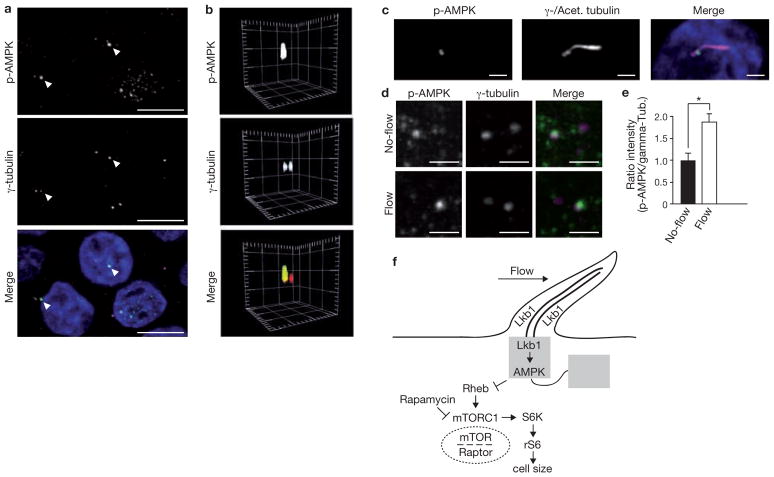
The mTOR pathway is the central regulator of cell size. External signals from growth factors and nutrients converge on the mTORC1 multi-protein complex to modulate downstream targets, but how the different inputs are integrated and translated into specific cellular responses is incompletely understood. Deregulation of the mTOR pathway occurs in polycystic kidney disease (PKD), where cilia (filiform sensory organelles) fail to sense urine flow because of inherited mutations in ciliary proteins. We therefore investigated if cilia have a role in mTOR regulation. Here, we show that ablation of cilia in transgenic mice results in enlarged cells when compared with control animals. In vitro analysis demonstrated that bending of the cilia by flow is required for mTOR downregulation and cell-size control. Surprisingly, regulation of cell size by cilia is independent of flow-induced calcium transients, or Akt. However, the tumour-suppressor protein Lkb1 localises in the cilium, and flow results in increased AMPK phosphorylation at the basal body. Conversely, knockdown of Lkb1 prevents normal cell-size regulation under flow conditions. Our results demonstrate that the cilium regulates mTOR signalling and cell size, and identify the cilium-basal body compartment as a spatially restricted activation site for Lkb1 signalling.


Conflict of interest statement

COMPETING FINANCIAL INTERESTS

The authors declare no competing financial interests.

Figures

Figure 1
Figure 1
Cilia regulate cell size under flow conditions. (a) 3D reconstruction of collecting ducts in kidney sections from control mice (left) and kidney-specific Kif3a-mutant-mice (right). Apical membrane stained with DBA; green, basolateral membrane stained with aquaporin-3; red. Mean cell volumes: controls, 233 ± 26 μm3 (n = 120); Kif3a mutants, 314 ± 24 μm3 (n = 189). (b) Cell volumes in control and Kif3a-mutant kidneys. In the Kif3a mutants, 22% of cells had volumes > 391 μm3 versus 6.3% in controls (P < 0.001, Mann-Whitney U test). (c) Western blot of lysates from Kif3a-i MDCK cells. Cells were established so that expression of shRNA against Kif3a, and a GFP reporter, were inducible with tetracycline. Cells were treated with or without tetracycline, as indicated. (d) Representative fluorescence microscopy images of Kif3a-i cells treated with tetracycline to express GFP (green in merged image) and knockdown Kif3a, and stained with anti-acetylated tubulin (red in merged image) and Hoechst (blue in merged image). GFP-positive cells: 85% (Supplementary Information Fig. S1a). (e) Size of Kif3a-i cells with and without tetracycline under non-flow conditions. n = 3. (f) Representative DIC microscopy images of MDCK cells grown under flow or non-flow conditions. Cells indicated by dots. (g) MDCK cell size after 6 days under indicated flow conditions (no flow, n = 12; flow, n = 21; asterisk indicates P < 0.0001). (h) Time course microscopy analysis of cell size. Data are from a single representative experiment for each condition. 5–10 visual fields per data point. Data are means ± s.d. Asterisks indicate P < 0.001. (i) 3D rendering of cells after in vivo membrane staining. Cells grown without flow, or after 5 days of flow. Cyan; small cells, magenta; large cells. (j) Mean cell volumes of wild-type MDCK cells under non-flow (n = 9, 153 cells), compared with flow (n = 6, 194 cells, P < 0.001). (k) Cell sizes of Kif3a-i cells grown under flow conditions with tetracycline (n = 21) and without tetracycline (n = 13). Asterisk indicates P < 0.001. Data in e, g, j and k are means ± s.e.m. Scale bars, 10 μm.
Figure 2
Figure 2
Cilia and flow modulate mTORC1 activity. (a) Western blot to assess mTOR phosphorylation in ciliated wild-type MDCK cells grown under flow and non-flow conditions. (b) Intensity of phosphorylated mTOR (p-mTOR) bands, relative to intensity of mTOR bands, from four independent experiments performed as in a. Asterisk indicates P < 0.05. (c) Western blot to assess phosphorylation of S6K (p-S6K) in ciliated MDCK cells grown under flow and non-flow conditions. (d) Intensity of p-S6K bands, relative to intensity of S6K bands, from three independent experiments performed as in c. Asterisk indicates P < 0.05. (e) Western blot to assess how induction of Kif3a knockdown in Kif3a-i cells under flow affects mTOR phosphorylation. (f) Intensity of p-mTOR bands, relative to intensity of mTOR bands, from four independent experiments performed as in e. Asterisk indicates P < 0.05. (g) Western blot to assess how induction of Kif3a knockdown in Kif3a-i cells under flow affects S6K phosphorylation. (h) Intensity of p-S6K bands relative to intensity of S6K bands, from four independent experiments performed as in g. Asterisk indicates P < 0.05. (i) Western blot of lysates from Kif3a-i cells, treated with tetracycline as indicated, before the onset of flow and after 5 days under flow conditions, to assess S6K phosphorylation. (j) Western blot of lysates from cells with tetracycline-inducible expression of Ift88 shRNA, treated with tetracycline as indicated, and grown under flow conditions. (k) Intensity of p-S6K bands, relative to intensity of S6K bands, from five independent experiments, performed as in j. Asterisk indicates P < 0.01. (l) Western blot to assess levels of phosphorylated ribosomal S6 protein (p-rS6) in the kidneys of wild-type and Kif3a-mutant mice. (m) Intensity of the p-rS6 bands, relative to the intensity of rS6 bands, from two independent experiments performed as in l. (n) Representative images from immunofluorescence microscopy of wild-type and Kif3a-mutant mice kidney sections at postnatal day 21. Sections are stained with antibodies against p-rS6 and Hoechst (blue). Scale bars, 10 μm. Data in b, d, f, h and k are means ± s.e.m. Uncropped images of blots are shown in Supplementary Information, Fig. S6.
Figure 3
Figure 3
Flow-induced cell-size regulation is mTOR dependent and ablation of flow-induced calcium transients has no effect on cell size. (a) Size of Kif3a-i cells, in absence or presence of tetracycline and treated as indicated, under flow conditions. Uninduced Kif3a-i cells (filled bars), n = 6; with rapamycin, n = 6; P = 0.3. Kif3a-i knockdown cells (unfilled bars), n = 10; with rapamycin, n = 9. Asterisk indicates P < 0.001. (b) DIC microscopy images of Kif3a-i cells treated as indicated and grown under flow conditions for 5 days. Cells are indicated by dots. (c) Size of the indicated Kif3a-i cells, in absence or presence of tetracycline, under flow conditions. Raptor-i, Kif3a-i cells with tetracycline-inducible expression of Raptor shRNA; dnRaptor; cells with tetracycline-inducible expression of a dominant-negative Raptor mutant. Kif3a-i cells with tetracycline, n = 21. Kif3a-i, Raptor-i cells, n = 6. Kif3a-i, dnRaptor cells, n = 5. (d) Western blot to assess phosphorylation of mTOR after induction of a gain of function Rheb mutant in cells under flow conditions. (e) Intensity of p-mTOR bands, relative to intensity of mTOR bands, from five independent experiments performed as in d. Asterisk indicates P < 0.05. (f) Representative DIC microscopy images of MDCK cells expressing the tetracycline-inducible Rheb mutant, grown under flow conditions for 5 days. Cells are indicated by dots. (g) Size of MDCK cells expressing the tetracycline-inducible Rheb mutant, grown under flow conditions for 5 days. n = 14 (cells without tetracycline) and n = 16. Asterisk indicates P < 0.0001. (h, i) Intracellular calcium measurements of MDCK cells with tetracycline-inducible expression of TRPP2 shRNA (TRPP2-i cells), without tetracycline induction (h), and with tetracycline induction (i). Thin traces, individual cells; bold trace, mean calcium value. ATP stimulation demonstrates cell viability. Scale bar indicates length of 200 s on x axis. Flow indicates onset of flow. (j) Size of TRPP2-i cells under flow conditions. Without tetracycline; n = 7 and with; n = 10; P = 0.8. (k) Western blots of lysates from TRPP2-i cells under flow conditions and treated with tetracycline as indicated. Data in a, c, e, g and j are means ± s.e.m. Scale bars, 10 μm. Uncropped images of blots are shown in Supplementary Information, Fig. S6.
Figure 4
Figure 4
Lkb1 modulates flow-dependent mTOR and cell-size regulation and is localized in the basal body and the cilium. (a) Western blot of lysates from Lkb1-i MDCK cells. Cells were established so that expression of shRNA against Lkb1, and expression of GFP, were inducible with tetracycline. Cells were treated with or without tetracycline, as indicated. (b) Representative fluorescence microscopy images of Lkb1-i cells treated with tetracycline, which induces Lkb1 knockdown and GFP expression (green in merged image). Cilia are identified by acetylated tubulin (red). (c) Size of indicated cells, treated with tetracycline as indicated, under non-flow conditions. dnLkb1 cells; MDCK cells with tetracycline-inducible expression of a dominant-negative Lkb1 mutant. Lkb1-i, n = 3, dnLkb1, n = 3, 10 visual fields per n. (d) Size of indicated cells, treated with tetracycline as indicated, under flow (Lkb1-i cells, n = 8, P < 0.001, dnLkb1 cells, n = 12, P < 0.001). (e) Western blot to assess S6K phosphorylation in Lkb1-i cells treated with tetracycline as indicated under flow. (f) Intensity of p-S6K bands relative to intensity of S6K bands, from three independent experiments performed as in e. Asterisk indicates P < 0.05. (g) Kif3a-i cells overexpressing Lkb1 were treated with tetracycline, as indicated, under flow, and size of the cells was measured (n = 6, P < 0.001). (h) Immunofluorescence microscopy of cilia from wild-type MDCK cells immunostained with antibodies against the indicated proteins. (i) Higher-magnification images of h. (j) Fluorescence microscopy images of MDCK cells expressing Lkb1–YFP and immunostained with antibodies against acetylated tubulin. (k) Fluorescence microscopy images of MDCK cells expressing Lkb1–YFP and immunostained with antibodies against γ-tubulin. Scale bars, 2 μm. Data in (c, d, f and g are means ± s.e.m. An uncropped image of the blot in e is shown in Supplementary Information, Fig. S6. Scale bars: a, b, hj, 10 μm; k, 2 μm.
Figure 5
Figure 5
Phosphorylated AMPK is localized at the basal body and increases under flow. (a) Immunofluorescence microscopy of MDCK cells under flow. Phosphorylated AMPK (p-AMPK, green) co-localizes with centrioles. The staining is more dominant at one centriole (arrowheads). Centrioles visualized by γ-tubulin (red). (b) 3D reconstruction of a centriole pair with phosphorylated AMPK at the apical pole of a single centriole. Spacing of grid marks 2 μm. (c) Immunofluorescence microscopy of wild-type MDCK cells. z-stack projection of the centrioles and the cilium (both magenta) reveals staining of p-AMPK (green) at the transition between basal body and the cilium. Scale bars, 2 μm. (d) Immunofluorescence microscopy of wild-type MDCK cells grown under the indicated flow conditions. Phosphorylated AMPK; green, centrioles; magenta. Scale bars, 2 μm. (e) Quantification of phosphorylated AMPK signal intensity, compared with γ-tubulin intensity, from immunofluorescence microscopy of wild-type MDCK cells grown under the indicated flow conditions. Asterisk indicates P < 0.05, n = 3, 33 cells per n. (f) Schematic representation depicting mTOR regulation through cilia. Data in e are means ± s.e.m.

Comment in

References

    1. Wullschleger S, Loewith R, Hall MN. TOR signaling in growth and metabolism. Cell. 2006;124:471–484. - PubMed
    1. Laplante M, Sabatini DM. mTOR signaling at a glance. J Cell Sci. 2009;122:3589–3594. - PMC - PubMed
    1. Polak P, Hall MN. mTOR and the control of whole body metabolism. Curr Opin Cell Biol. 2009;21:209–218. - PubMed
    1. Ma XM, Blenis J. Molecular mechanisms of mTOR-mediated translational control. Nat Rev Mol Cell Biol. 2009;10:307–318. - PubMed
    1. Tao Y, Kim J, Schrier RW, Edelstein CL. Rapamycin markedly slows disease progression in a rat model of polycystic kidney disease. J Am Soc Nephrol. 2005;16:46–51. - PubMed

Publication types