

Does attention-deficit/hyperactivity disorder have a dimensional latent structure? A taxometric analysis
- PMID: 20973595
- PMCID: PMC3091987
- DOI: 10.1037/a0021405
Does attention-deficit/hyperactivity disorder have a dimensional latent structure? A taxometric analysis
Abstract
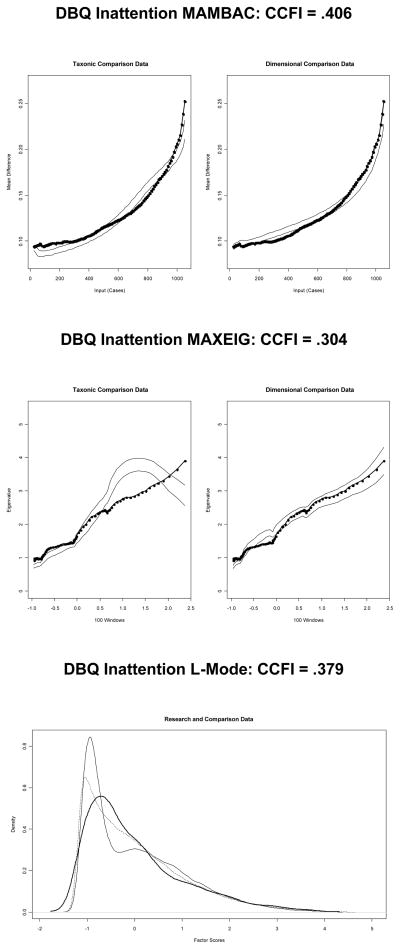
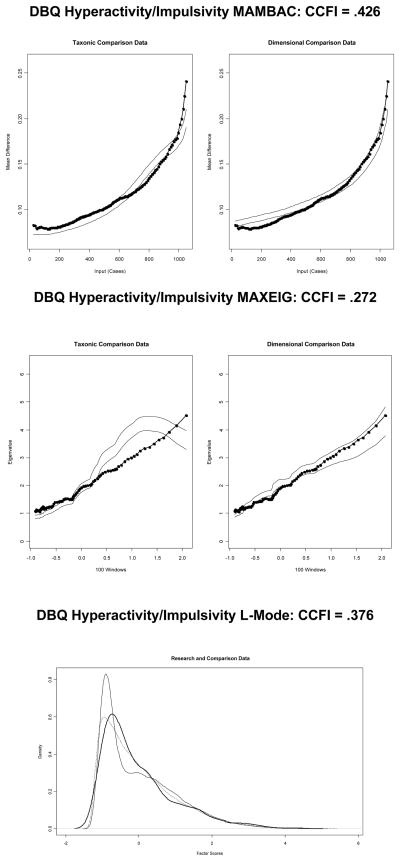
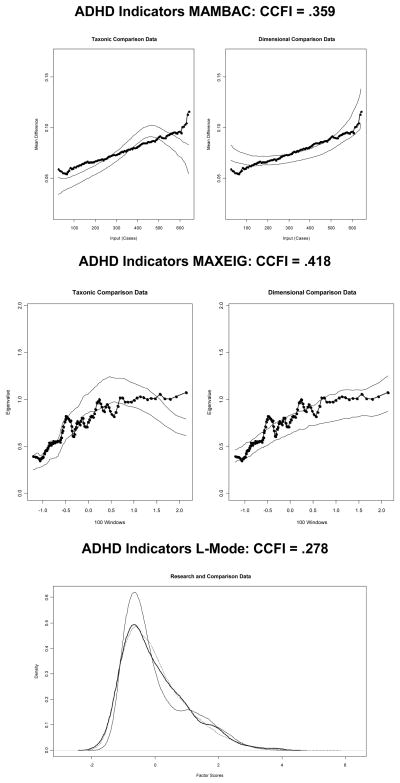
An understanding of the latent structure of attention-deficit/hyperactivity disorder (ADHD) is essential for developing causal models of this disorder. Although some researchers have presumed that ADHD is dimensional and others have assumed that it is taxonic, there has been relatively little research directly examining the latent structure of ADHD. The authors conducted a set of taxometric analyses using data from the NICHD Study of Early Child Care and Youth Development (ns between 667 and 1,078). The results revealed a dimensional latent structure across a variety of different analyses and sets of indicators for inattention, hyperactivity/impulsivity, and ADHD. Furthermore, analyses of correlations with associated features indicated that dimensional models demonstrated stronger validity coefficients with these criterion measures than dichotomous models. These findings jibe with recent research on the genetic basis of ADHD and with contemporary models of ADHD.
Figures
References
-
- Achenbach TM. Manual for the Child Behavior Checklist and 1991 Profile. Burlington, VT: University of Vermont, Department of Psychiatry; 1991a.
-
- Achenbach TM. Manual for the Teacher’s Report Form and 1991 Profile. Burlington, VT: University of Vermont, Department of Psychiatry; 1991b.
-
- Achenbach TM, McConaughy SH. Empirically based assessment of child and adolescent psychopathology: Practical applications. Thousand Oaks, CA: Sage; 1997.
-
- Althoff RR, Copeland WE, Stanger C, Derks EM, Todd RD, Neuman RJ, …Hudziak JJ. The latent class structure of ADHD is stable across informants. Twin Research and Human Genetics. 2006;9:507–522. - PubMed
Publication types
MeSH terms
Grants and funding
LinkOut - more resources
Full Text Sources
Medical
Miscellaneous
