. 2011 Feb;162(4):863-79.
doi: 10.1111/j.1476-5381.2010.01087.x.

Roles of affinity and lipophilicity in the slow kinetics of prostanoid receptor antagonists on isolated smooth muscle preparations

Affiliations

Roles of affinity and lipophilicity in the slow kinetics of prostanoid receptor antagonists on isolated smooth muscle preparations

R L Jones et al. Br J Pharmacol. 2011 Feb.

Abstract

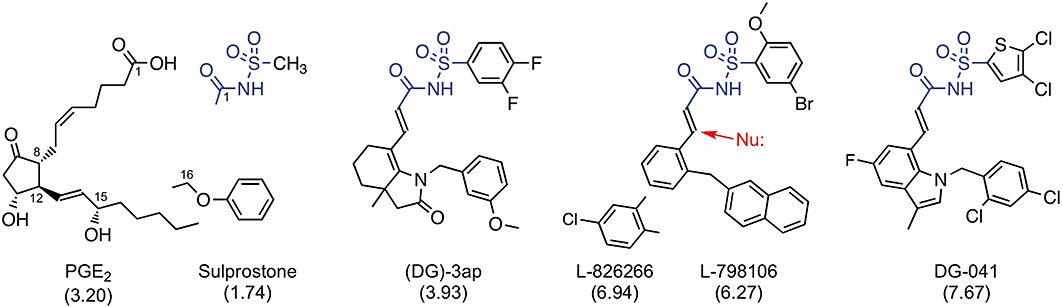
Background and purpose: The highly lipophilic acyl-sulphonamides L-798106 and L-826266 showed surprisingly slow antagonism of the prostanoid EP₃ receptor system in guinea-pig aorta. Roles of affinity and lipophilicity in the onset kinetics of these and other prostanoid ligands were investigated.

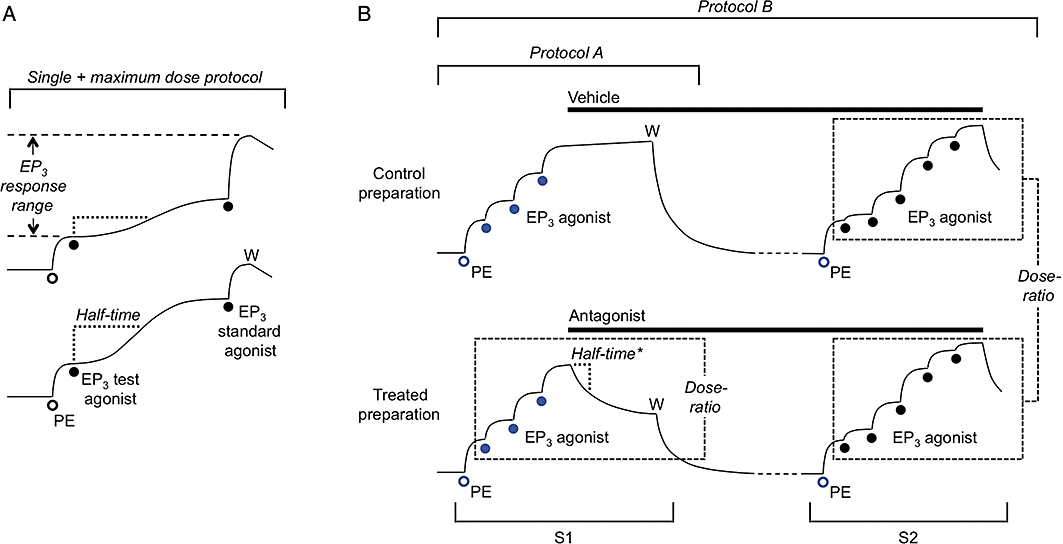
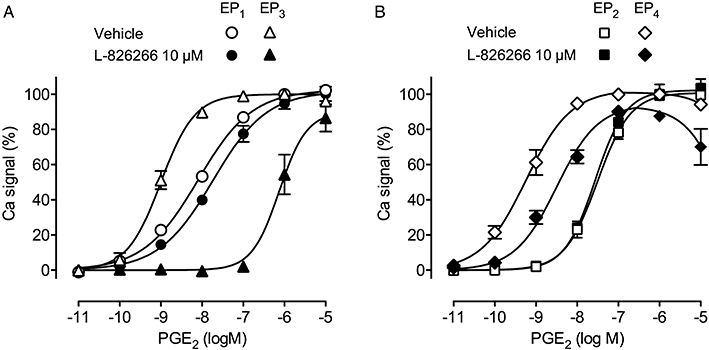
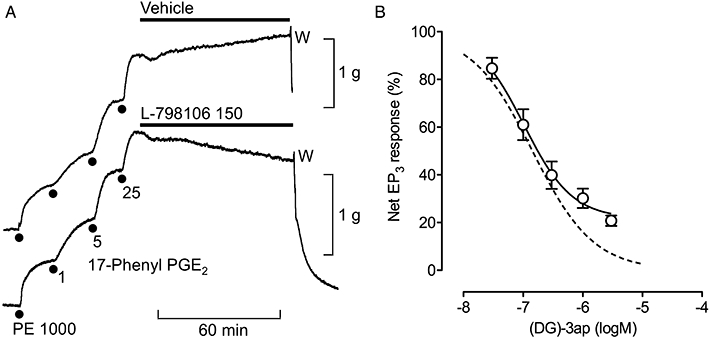
Experimental approach: Antagonist selectivity was assessed using a panel of human recombinant prostanoid receptor-fluorimetric imaging plate reader assays. Potencies/affinities and onset half-times of agonists and antagonists were obtained on guinea-pig-isolated aorta and vas deferens. n-Octanol-water partition coefficients were predicted.

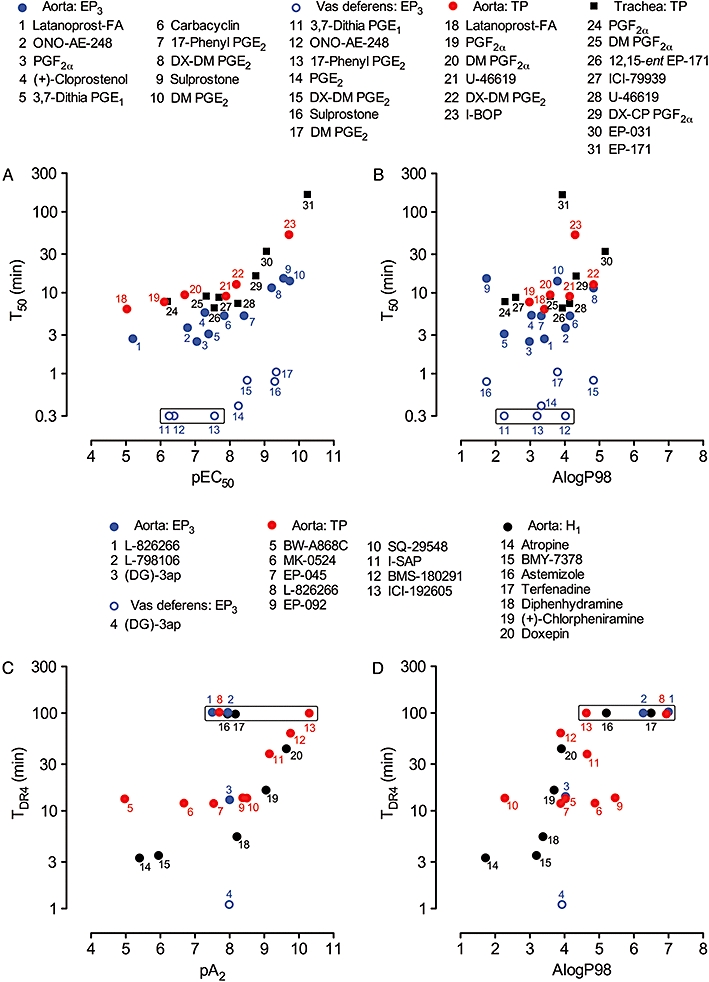
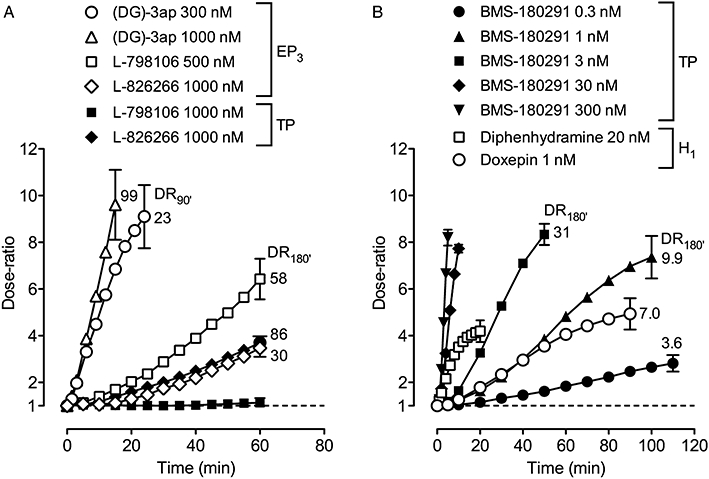
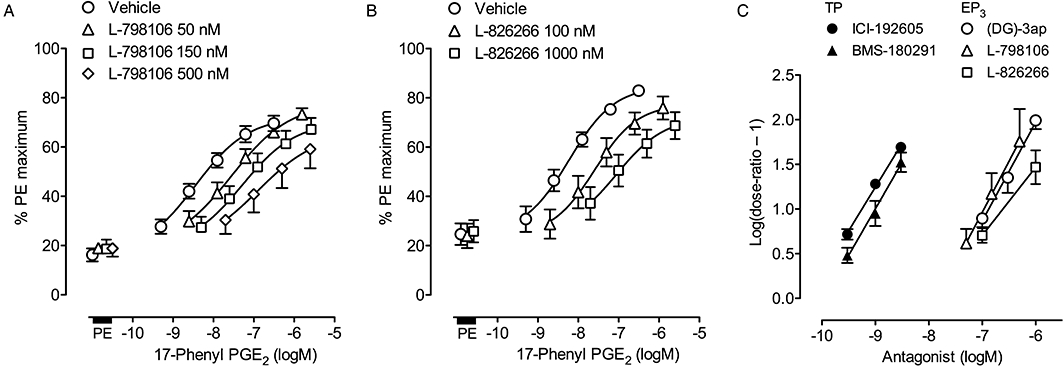
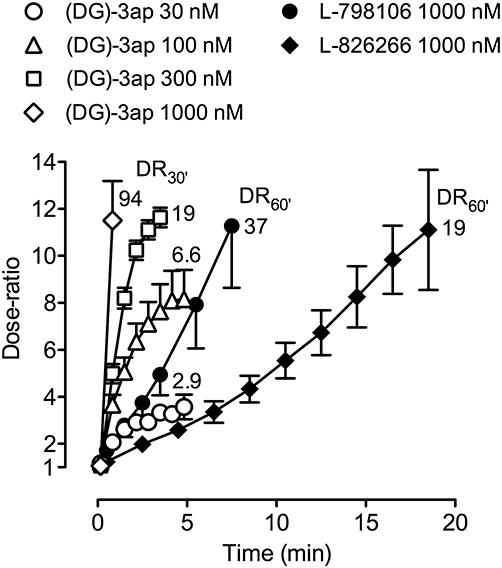
Key results: L-798106, L-826266 and the less lipophilic congener (DG)-3ap appear to behave as selective, competitive-reversible EP₃ antagonists. For ligands of low to moderate lipophilicity, potency increments for EP₃ and TP (thromboxane-like) agonism on guinea-pig aorta (above pEC₅₀ of 8.0) were associated with progressively longer onset half-times; similar trends were found for TP and histamine H₁ antagonism above a pA₂ limit of 8.0. In contrast, L-798106 (EP₃), L-826266 (EP₃, TP) and the lipophilic H₁ antagonists astemizole and terfenadine exhibited very slow onset rates despite their moderate affinities; (DG)-3ap (EP₃) had a faster onset. Agonism and antagonism on the vas deferens EP₃ system were overall much faster, although trends were similar.

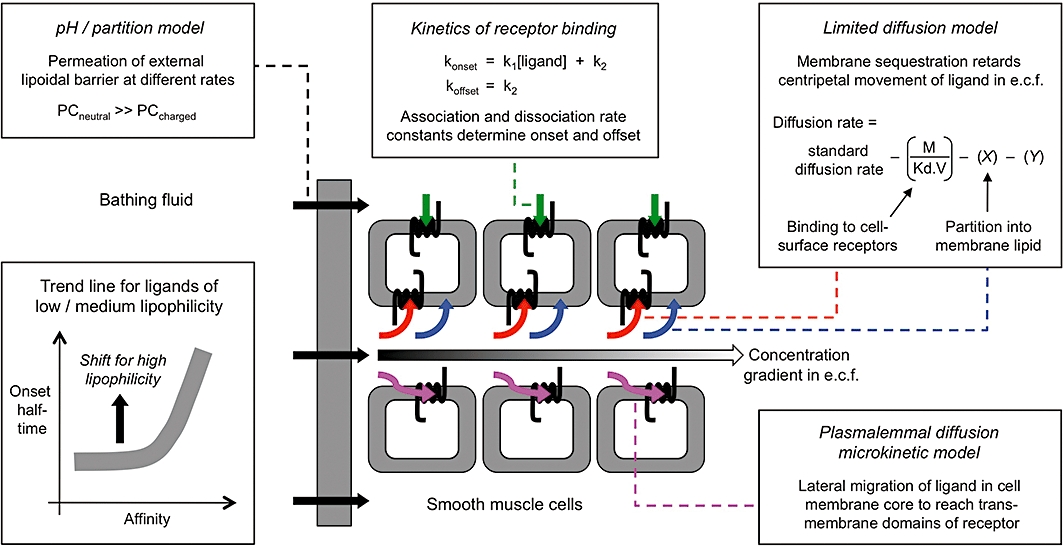
Conclusions and implications: High affinity and high liphophilicity may contribute to the slow onsets of prostanoid ligands in some isolated smooth muscle preparations. Both relationships are explicable by tissue disposition under the limited diffusion model. EP₃ antagonists used as research tools should have moderate lipophilicity. The influence of lipophilicity on the potential clinical use of EP₃ antagonists is discussed.


Figures

Figure 1
Figure 1
Structures of EP3 receptor ligands: prostaglandin E2 (PGE2) and its analogue sulprostone are agonists; the other compounds are antagonists. All compounds are weak acids: proton loss from carboxylate group or acyl-sulphonamide unit (blue). Predicted n-octanol-water partition coefficients (AlogP98) are shown in parentheses; differences between the antagonists are mainly due to the (lower) acyl moieties. The red arrow indicates potential covalent attack on the α, β-unsaturated amide group by a nucleophile (Nu:).
Figure 9
Figure 9
Processes potentially contributing to the kinetic profile of a receptor ligand in a multiple cell-layer tissue. Clockwise from upper left, boxes depict: (i) Passage of ligand through a lipoidal barrier surrounding the tissue mass (PC, permeability coefficient; see Pratt, 1990). (ii) Kinetics of ligand – receptor interaction. (iii) Cellular sequestration retarding movement of ligand through the extracellular fluid (e.c.f.) (limited diffusion model). For binding to cell-surface receptors, M, receptor density; Kd, equilibrium dissociation constant of ligand; V, volume of biophase. X represents a factor for partition into cell membrane lipid and Y a factor for any other sequestration process (e.g. active uptake). (iv) Access of ligand to the transmembrane domains of the receptor via lateral diffusion through the lipid core of the cell membrane (plasmalemmal diffusion microkinetic model). Processes (iii) and (iv) both tend to slow the build-up of ligand concentration in the centre of the tissue. The lower left box schematically shows the influence of ligand affinity and lipophilicity on onset rate based on data in Figure 8.
Figure 8
Figure 8
Correlations between onset rate and potency/affinity and between onset rate and lipophilicity on guinea-pig isolated smooth muscle preparations. Upper panels: plots of T50 versus (A) pEC50 and (B) AlogP98 for EP3 and TP agonists. Data points in each box indicate that responses were too rapid for accurate estimation of T50 (arbitrary location on 0.3 min level). Lower panels: plots of TDR4 versus (C) pA2 and (D) AlogP98 for EP3, TP and H1 antagonists. Data points in each box indicate that antagonism was too slow for TDR4 to be obtained (arbitrary location on 100 min level). L-798106 and L-826266 had slow onsets on the vas deferens EP3 system: see text. PGE2, prostaglandin E2; T50, onset half-time for an agonist to achieve 50% maximal response; TDR4, onset half-time for an antagonist corresponding to a dose-ratio of 4.
Figure 2
Figure 2
Cartoon showing protocols for isolated smooth muscle assays: in each case for guinea-pig aorta EP3 assay involving priming with phenylephrine (PE, open circles) in each cumulative agonist sequence. (A) Single + maximum dose protocol used for a slow-acting agonist. pEC50 for test agonist was derived from the mid-portion of its log concentration–response curve, which was obtained by applying single doses to individual preparations followed by a maximal dose of the standard agonist. Individual half-times were used to calculate an onset half-time corresponding to E50 (T50). (B) Antagonist protocols. Protocol A is a type of inhibition-curve protocol: the steady-state inhibition was converted into a dose-ratio (and corresponding pA2 value) using the three (EP3) agonist responses in sequence 1 (S1); a corresponding onset half-time (half-time*) was calculated from a dose-ratio – time plot. Protocol B is a Schild protocol: following washout of S1 primer/agonist (W), vehicle and antagonist treatments were continued before construction of agonist curves in S2; between-preparations dose-ratios were obtained for Schild analysis. Two additional preparations were usually treated with different concentrations of antagonist. The blue symbols indicate responses used in repeated-measures 2-factor anova (aorta EP3 assay only) to investigate matching of preparations in S1 and the effect of antagonist treatment on the priming response in S2.
Figure 3
Figure 3
Antagonism of prostaglandin E2 (PGE2)-induced Ca2+ flux by L-826266 (10 µM) in human recombinant (A) EP1/EP3 and (B) EP2/EP4 receptor systems. Each receptor was co-transfected with chimeric G-protein into HEK-293 EBNA cells; Ca2+ flux was measured by Fluo-4 fluorescence (fluorimetric imaging plate reader assay). Responses were normalized to the peak signal for 1 µM PGE2. Vertical bars show SEM (n= 3).
Figure 4
Figure 4
Inhibitory profiles of EP3 antagonists on guinea-pig aorta. Using protocol A, contraction was established with 25 nM 17-phenyl PGE2 under phenylephrine (PE) priming in the presence of the TP antagonist BMS-180291 (300 nM). (A) Slowly developing antagonism by L-798106; the transient initial fall in tension in both records is a typical effect of the vehicle (14 mM DMSO). Concentrations in nM; W, wash. (B) Non-cumulative log concentration–inhibition curve for (DG)-3ap. The broken line is a predicted curve for complete inhibition of the net EP3 response corresponding to a pA2 of 7.92 for (DG)-3ap (protocol B) and nH of 0.85 for 17-phenyl PGE2. Vertical bars show SEM (n= 4–5).
Figure 5
Figure 5
Onset rates for antagonists on guinea-pig aorta under protocol A presented as dose-ratio – time plots: (A) EP3 antagonists versus 17-phenyl PGE2 and U-46619; (B) TP antagonist BMS-180291 versus U-46619 and H1 antagonists diphenhydramine and doxepin versus histamine. For clarity, SEM (n= 4–5) for each final time-point only is shown. The value adjacent to a curve is the mean dose-ratio achieved after continuation of antagonist treatment for a total of 90 min (DR90′) or 180 min (DR180′) under protocol B. BMS-180291 (300 nM) was present throughout the EP3 measurements in (A).
Figure 6
Figure 6
Estimation of pA2 values for prostanoid antagonists on guinea-pig aorta using a Schild protocol (protocol B, Figure 2B). (A) and (B) EP3 assay: log concentration–response curves for 17-phenyl PGE2 in the presence of L-798106 and L-826266 (180 min treatment); PE, phenylephrine priming. BMS-180291 (300 nM) was present for all tests. (C) Schild plots: TP agonist was U-46619; EP3 agonist was 17-phenyl PGE2. Vertical bars show SEM (all n= 4).
Figure 7
Figure 7
Onset rates of EP3 antagonists on guinea-pig vas deferens presented as dose-ratio – time plots. Under protocol A, inhibition of electrical field stimulation twitch contraction induced by 15 nM prostaglandin E2 was reversed by antagonist application. Vertical bars show SEM (all n= 4). The first two data points on each (DG)-3ap curve correspond to 10 and 50 s after antagonist addition. The value adjacent to each curve is the mean dose-ratio achieved after continuation of antagonist treatment for a total of 30 min (DR30′) or 60 min (DR60′) under protocol B.

Similar articles

Cited by

References

    1. Alexander SPH, Mathie A, Peters JA. Guide to Receptors and Channels (GRAC) Br J Pharmacol. (4th edn) 2009;158(Suppl. 1):S1–S254. - PMC - PubMed
    1. Anderson GP. Formoterol: pharmacology, molecular basis of agonism, and mechanism of long duration of a highly potent and selective β2-adrenoceptor agonist bronchodilator. Life Sci. 1993;52:2145–2160. - PubMed
    1. Anderson GP, Lindén A, Rabe KF. Why are long-acting beta-adrenoceptor agonists long-acting? Eur Respir J. 1994;7:569–578. - PubMed
    1. Austin RP, Barton P, Bonnert RV, Brown RC, Cage PA, Cheshire DR, et al. QSAR and the rational design of long-acting dual D2-receptor/β2-adrenoceptor agonists. J Med Chem. 2003;46:3210–3220. - PubMed
    1. Avdeef A, Box KJ, Takács-Kovák K. pH-metric logP. 6. Effects of sodium, potassium and N-CH3-D-glucamine on the octanol-water partitioning of prostaglandins E1 and E2. J Pharm Sci. 1995;84:523–529. - PubMed

Publication types

MeSH terms

LinkOut - more resources