

An investigation of patterns in hemodynamic data indicative of impending hypotension in intensive care
- PMID: 20973998
- PMCID: PMC2976741
- DOI: 10.1186/1475-925X-9-62
An investigation of patterns in hemodynamic data indicative of impending hypotension in intensive care
Abstract
Background: In the intensive care unit (ICU), clinical staff must stay vigilant to promptly detect and treat hypotensive episodes (HEs). Given the stressful context of busy ICUs, an automated hypotensive risk stratifier can help ICU clinicians focus care and resources by prospectively identifying patients at increased risk of impending HEs. The objective of this study was to investigate the possible existence of discriminatory patterns in hemodynamic data that can be indicative of future hypotensive risk.
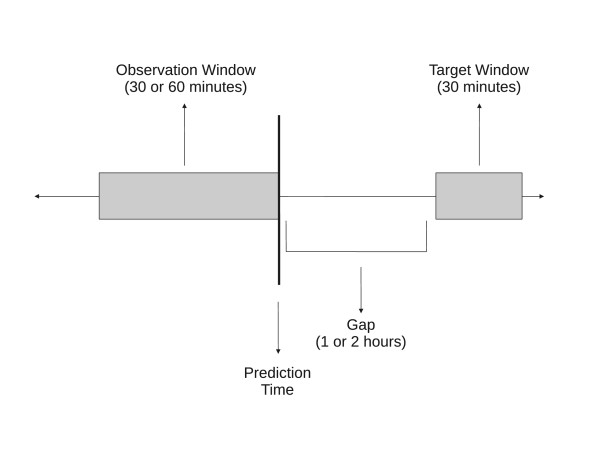
Methods: Given the complexity and heterogeneity of ICU data, a machine learning approach was used in this study. Time series of minute-by-minute measures of mean arterial blood pressure, heart rate, pulse pressure, and relative cardiac output from 1,311 records from the MIMIC II Database were used. An HE was defined as a 30-minute period during which the mean arterial pressure was below 60 mmHg for at least 90% of the time. Features extracted from the hemodynamic data during an observation period of either 30 or 60 minutes were analyzed to predict the occurrence of HEs 1 or 2 hours into the future. Artificial neural networks (ANNs) were trained for binary classification (normotensive vs. hypotensive) and regression (estimation of future mean blood pressure).
Results: The ANNs were successfully trained to discriminate patterns in the multidimensional hemodynamic data that were predictive of future HEs. The best overall binary classification performance resulted in a mean area under ROC curve of 0.918, a sensitivity of 0.826, and a specificity of 0.859. Predicting further into the future resulted in poorer performance, whereas observation duration minimally affected performance. The low prevalence of HEs led to poor positive predictive values. In regression, the best mean absolute error was 9.67%.
Conclusions: The promising pattern recognition performance demonstrates the existence of discriminatory patterns in hemodynamic data that can indicate impending hypotension. The poor PPVs discourage a direct HE predictor, but a hypotensive risk stratifier based on the pattern recognition algorithms of this study would be of significant clinical value in busy ICU environments.
Figures
References
-
- Saeed M, Lieu C, Raber G, Mark RG. MIMIC II: a massive temporal ICU patient database to support research in intelligent patient monitoring. Computers in Cardiology. 2002;29:641–644. - PubMed
-
- Antman E, Anbe D, Armstrong P, Bates E, Green L, Hand M, Hochman J, Krumholz H, Kushner F, Lamas G, Mullany C, Ornato J, Pearle D, Sloan M, Smith S, Alpert J, Anderson J, Faxon D, Fuster V, Gibbons R, Gregoratos G, Halperin J, Hiratzka L, Hunt S, Jacobs A. ACC/AHA guidelines for the management of patients with ST-elevation myocardial infarction. Circulation. 2004;110:e82e–292. doi: 10.1161/01.CIR.0000134791.68010.FA. - DOI - PubMed
Publication types
MeSH terms
Grants and funding
LinkOut - more resources
Full Text Sources
Other Literature Sources
Medical
