. 2010 Nov 29;28(51):8077-84.
doi: 10.1016/j.vaccine.2010.10.023. Epub 2010 Oct 23.

Intrinsic defects in B cell response to seasonal influenza vaccination in elderly humans

Affiliations

Intrinsic defects in B cell response to seasonal influenza vaccination in elderly humans

Daniela Frasca et al. Vaccine. .

Abstract

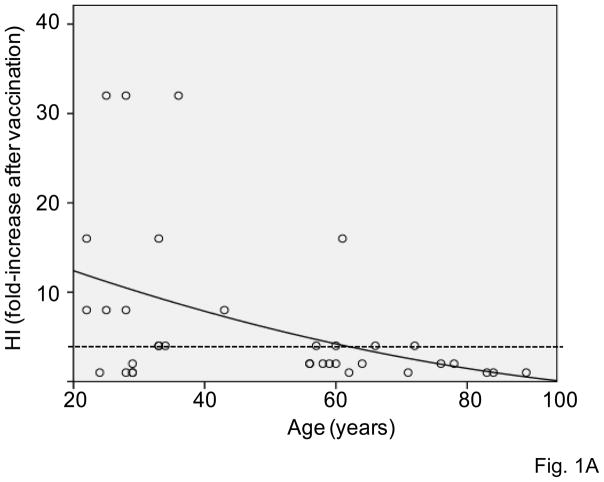
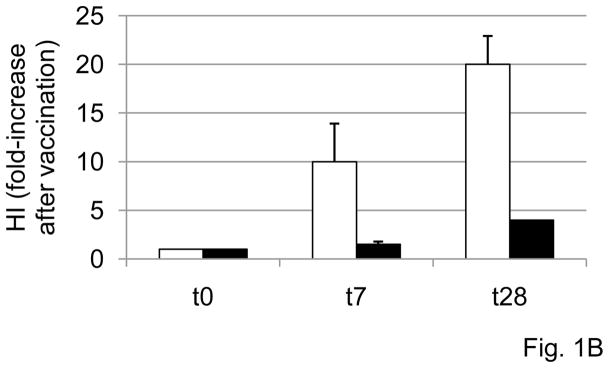
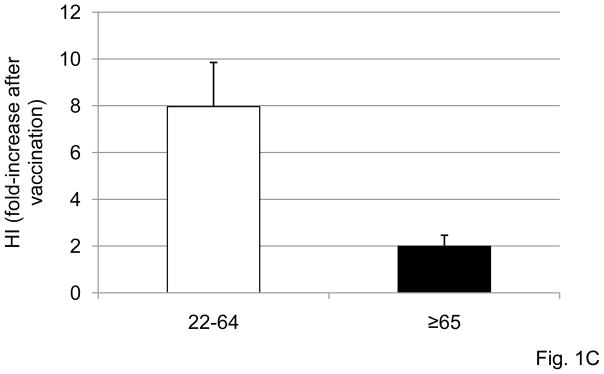
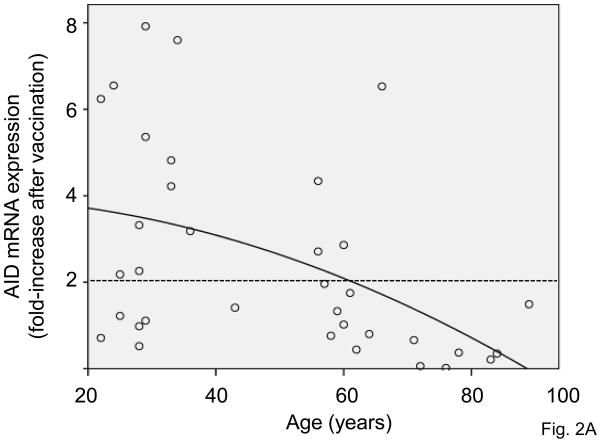
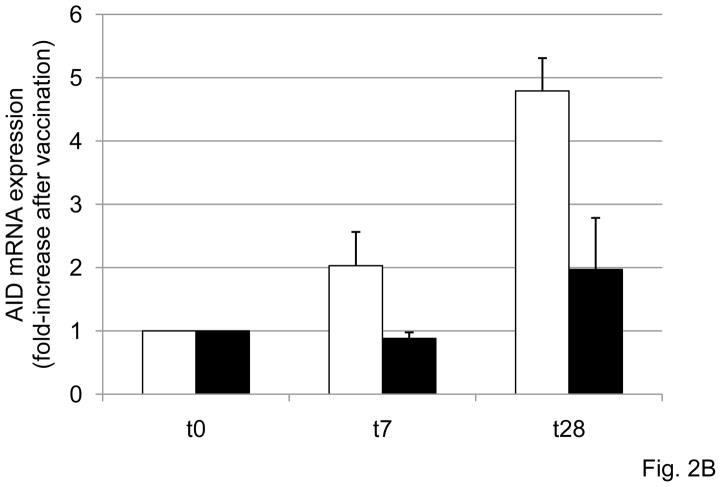
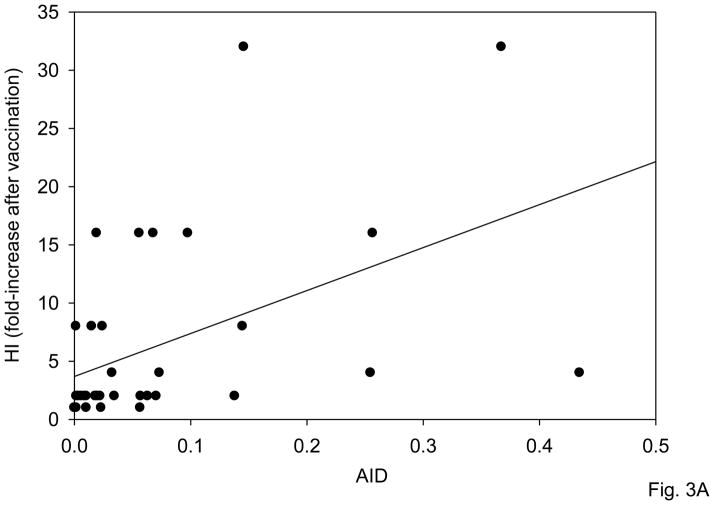
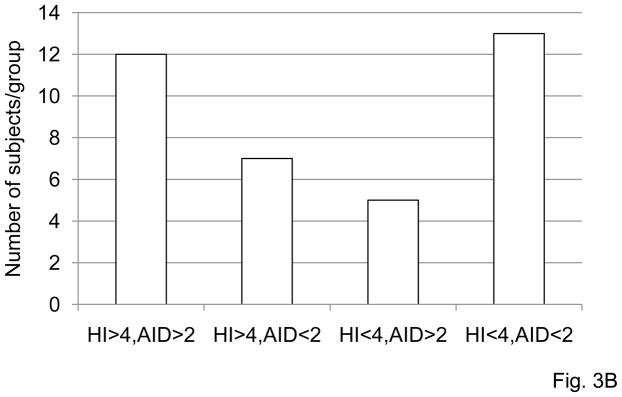
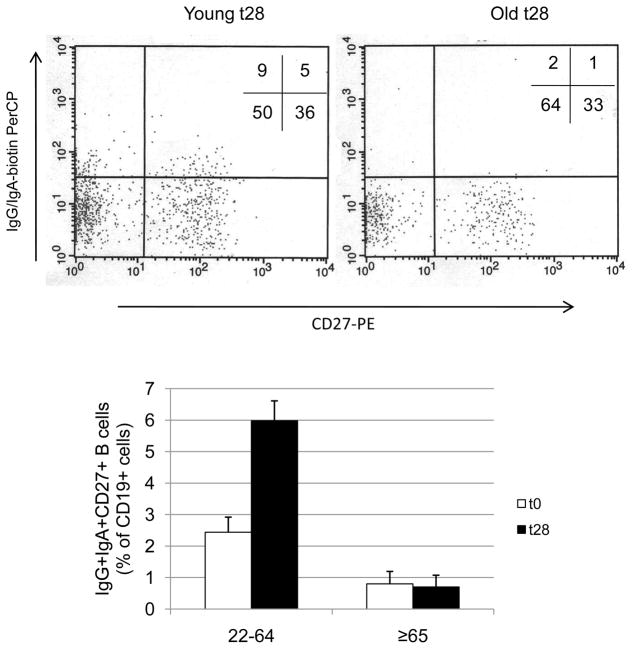
We have evaluated the serum response to seasonal influenza vaccination in subjects of different ages and associated this with the specific B cell response to the vaccine in vitro. Although the serum response has previously been shown to decrease with age, this has largely been associated to decreased T cell functions. Our results show that in response to the vaccine, the specific response of B cells in vitro, as measured by AID (activation-induced cytidine deaminase), the in vivo serum HI (hemagglutination inhibition) response, and the in vivo generation of switch memory B cells are decreased with age, as evaluated in the same subjects. This is the first report to demonstrate that intrinsic B cell defects with age contribute to reduced antibody responses to the influenza vaccine. The level of AID in response to CpG before vaccination can also predict the robustness of the vaccine response. These results could contribute to developing more effective vaccines to protect the elderly as well as identifying those most at risk.


Figures

Figure 1
Figure 1. Serum HI response to influenza vaccination decreases with age
A. Sera isolated from subjects of different ages, before (t0) or after vaccination (t28), were collected and analyzed in HI assay to evaluate antibody production to vaccine. Results are expressed as fold-increase in titer after vaccination, calculated as follows: titer values after vaccination/titer values before vaccination. Thirty-seven subjects were evaluated, 29 young and 8 elderly. Two young subjects were not included because they were considered outliers (HI values >2 SDs above the mean). The dashed horizontal line indicates the threshold of a positive response in the HI test, which corresponds to 4-fold increase in the serum titer. Spearman’s rho =−0.449, p=0.005 (two-tailed). B. Sera isolated from the blood of 23 subjects of different ages (19 young and 4 elderly) at t0, t7 and t28 were tested in HI assay. Results are expressed as fold-increase in titer after vaccination, calculated as in A. The difference between young and old is significant at both t7 (p=0.040) and t28 (p=0.025), as evaluated by the Wilcoxon test. White columns: young. Black columns: elderly.
Figure 2
Figure 2. The in vitro AID response of B cells to influenza vaccination decreases with age
A. B cells (106 cells/ml), isolated from the PBMC of subjects of different ages, before (t0) or after vaccination (t28), were cultured with the vaccine, for 7 days. At the end of this time, cells were processed as described in Materials and Methods. Thirty-seven subjects were evaluated, 29 young and 8 old. Two young subjects were not included because they were considered outliers (AID mRNA values >2 SDs above the mean). The dashed horizontal line indicates the threshold of a positive response in AID mRNA expression which was arbitrarily defined as 2-fold increase. Spearman’s rho =−0.527, p=0.001 (two-tailed). B. B cells (106 cells/ml), isolated from the PBMC of 10 subjects of different ages (6 young and 4 elderly), stimulated in vitro with the influenza vaccine for 7 days to induce optimal AID mRNA expression. At the end of this time, cells were harvested, RNA extracted and qPCR reactions performed to evaluate AID normalized to GAPDH transcripts. Results are expressed as fold-increase in AID mRNA expression after vaccination, calculated as follows: AID values after vaccination/AID values before vaccination. The difference between young and old is significant at both t7 (p=0.008) t28 (p=0.032), as evaluated by the Wilcoxon test. White columns: young. Black columns: elderly.
Figure 3
Figure 3. AID predicts HI response both before and after vaccination
A. B cells (106 cells/ml), isolated from the PBMC of subjects of different ages before vaccination were cultured with CpG, for 7 days. At the end of this time, cells were processed as described in Materials and Methods. Thirty-seven subjects were evaluated, 29 young and 8 old. AID values are qPCR at t0. HI was measured at t0 and t28 as in Fig. 1 and fold-increase presented. Spearman’s rho=0.614, p=0.0001 (two-tailed). B. Same subjects as in A were analyzed for fold-increase in HI and correlated with the fold-increase in in vitro influenza-induced AID. Four categories were identified: HI>4/AID>2; HI<4/AID<2; HI>4/AID<2 and HI<4/AID>2. Most of the subjects (68%) fall within the two categories, hi HI/hi AID and low HI/low AID and is significant (p<0.05) by χ2. Kruskal-Wallis analysis was performed to examine whether there was a discernible pattern of age between groups HI>4/AID>2, HI>4/AID<2, HI<4/AID>2 and group HI<4/AID<2. The latter group, HI<4/AID<2, had most of the elderly in the study. This was statistically significant F(3,36)=6.53, p<0.001.
Figure 4
Figure 4. The percentages of IgG+IgA+CD27+ switch memory B cells increase after vaccination in young but not in elderly subjects
One hundred μl of blood from young and elderly subjects at t0 and t28 were stained as described in Materials and Methods. A representative dot plot is shown for one young and one elderly subject, both at t28. Twenty-one subjects were evaluated, 16 young and 5 elderly. The difference between young and elderly at t0 and t28 is significant (U=17, p=0.048 and U=0.0001, p=0.001, respectively). The difference between t0 and t28 in young subjects is significant (p=0.0045), but in the elderly is not significant, as evaluated by the Wilcoxon test.

References

    1. Simonsen L, Clarke MJ, Schonberger LB, Arden NH, Cox NJ, Fukuda K. Pandemic versus epidemic influenza mortality: a pattern of changing age distribution. J Infect Dis. 1998 Jul;178(1):53–60. - PubMed
    1. Boraschi D, Del Giudice G, Dutel C, Ivanoff B, Rappuoli R, Grubeck-Loebenstein B. Ageing and immunity Addressing immune senescence to ensure healthy ageing. Vaccine. Apr 1; - PubMed
    1. Simonsen L, Taylor RJ, Viboud C, Miller MA, Jackson LA. Mortality benefits of influenza vaccination in elderly people: an ongoing controversy. Lancet Infect Dis. 2007 Oct;7(10):658–66. - PubMed
    1. Centers for Disease Control and Prevention. Racial/ethnic disparities in influenza and pneumococcal vaccination levels among persons aged > or = 65 years in the United States, 1989–2001. MMWR Morb Mortal Wkly Rep. 2003;52:958–62. - PubMed
    1. Gross PA, Hermogenes AW, Sacks HS, Lau J, Levandowski RA. The efficacy of influenza vaccine in elderly persons. A meta-analysis and review of the literature. Ann Intern Med. 1995 Oct 1;123(7):518–27. - PubMed

Publication types

Substances