. 2010 Dec;16(12):2570-80.
doi: 10.1261/rna.2162610. Epub 2010 Oct 25.

RiboSys, a high-resolution, quantitative approach to measure the in vivo kinetics of pre-mRNA splicing and 3'-end processing in Saccharomyces cerevisiae

Affiliations

RiboSys, a high-resolution, quantitative approach to measure the in vivo kinetics of pre-mRNA splicing and 3'-end processing in Saccharomyces cerevisiae

Ross D Alexander et al. RNA. 2010 Dec.

Abstract

We describe methods for obtaining a quantitative description of RNA processing at high resolution in budding yeast. As a model gene expression system, we constructed tetON (for induction studies) and tetOFF (for repression, derepression, and RNA degradation studies) yeast strains with a series of reporter genes integrated in the genome under the control of a tetO7 promoter. Reverse transcription and quantitative real-time-PCR (RT-qPCR) methods were adapted to allow the determination of mRNA abundance as the average number of copies per cell in a population. Fluorescence in situ hybridization (FISH) measurements of transcript numbers in individual cells validated the RT-qPCR approach for the average copy-number determination despite the broad distribution of transcript levels within a population of cells. In addition, RT-qPCR was used to distinguish the products of the different steps in splicing of the reporter transcripts, and methods were developed to map and quantify 3'-end cleavage and polyadenylation. This system permits pre-mRNA production, splicing, 3'-end maturation and degradation to be quantitatively monitored with unprecedented kinetic detail, suitable for mathematical modeling. Using this approach, we demonstrate that reporter transcripts are spliced prior to their 3'-end cleavage and polyadenylation, that is, cotranscriptionally.


Figures

FIGURE 1.
FIGURE 1.
Diagram showing important features of the RiboSys reporter genes and the positions of hybridization probes and primers used in reverse transcription (RT) and RT-qPCR reactions. The reporter genes are modified from those developed by Hilleren and Parker (2003). Briefly, exon 1 contains the ACT1 5′ UTR and 30 codons from PGK1 and ACT1 sequences, and is followed by the ACT1 intron, then exon 2, which contains ∼100 bp of PGK1 fused in frame with three copies of the haemaglutinin epitope (3HA), followed by six MS2 coat protein binding sites (6MS2) at the start of the PGK1 3′ UTR. To further discriminate between the reporter transcripts and endogenous ACT1 and PGK1 transcripts in RT-qPCR assays we inserted two copies of the lambda N (box B; 57 bp) sequence 51 bp downstream from the ACT1 5′ splice site. Transcription of the RiboSys reporters is under control of the tetO7/CYC1-UAS promoter and the tetracycline (or doxycycline) regulatable dual activator/repressor system (Belli et al. 1998b). The intron is represented by a thin line with letters indicating splice signals (uppercase) and positions of splice site mutations (lowercase). Positions of flourophore probes used in FISH experiments are indicated below the reporter: 11 probes for mRNA and eight probes for intron (pre-mRNA) detection. Primers used for RT-qPCR assays are indicated by arrows and a northern probe by a black line. Primer pairs, p2_F and p2_R, amplify the 5′SS region of unspliced pre-mRNA. Exonic primer pairs, m2_F and m2_R, are used to quantify the spliced mRNA under conditions that do not produce a product from unspliced pre-mRNA. E2_F and E1_R measure all forms of this transcript regardless of their progress through the splicing reactions. The intron-containing products of the first and second steps of splicing are branched/lariat structures, containing a 2′-5′ phosphodiester bond that blocks the progress of reverse transcriptase from the 3′ end of the intron. The lariat intron-exon2 species can be measured in two ways. First, the product produced by primers 3′_F and 3′_R that flank the 3′SS, represents the sum of the unspliced pre-mRNA and the lariat intron-exon2 species. The difference between this and the RT-qPCR product of unspliced transcripts that crosses the 5′SS is due to the lariat intron-exon2 species. Second, oligonucleotide L1_R with the 5′ end complementary to the 5′ end of the intron and the 3′ end complementary to the intron sequence immediately 5′ of the branch site, but with a mismatch (A instead of T) opposite the branch site A (Vogel et al. 1997), anneals at the branch site of lariats and can be used to prime the RT reaction. and, with L1-F, primes RT-qPCR amplification of the circular part of the lariat. This measures the sum of the lariat-exon product of the first splicing reaction and the excised intron lariat product of the second splicing reaction. In normal conditions, the level of lariat species is very low, as the lariat intron-exon2 product of the first splicing reaction is rapidly processed in the second step and the excised intron is rapidly debranched and degraded. However, if the second splicing reaction is slow or blocked or if there is a defect in release and degradation of the excised intron, these species can be quantified. The sequences of all oligos are listed in Supplemental Table S3.
FIGURE 2.
FIGURE 2.
Scheme of work for estimating RNA copy number by determining the efficiency of cell lysis, RNA extraction, RT-qPCR, and FISH imaging. Briefly, the cell number is determined and the efficiency of cell lysis is estimated based on the amount of DNA recovered (total DNA is assayed spectroscopically and individual genes by RT-qPCR) compared with the expected amount of DNA, assuming that in an exponentially growing population of haploid cells the average cell contains 1.4 genomes worth of nuclear DNA. The S. cerevisiae genome is ∼0.012 pg (Fungal Genome Size Database www.zbi.ee/fungal-genomesize). Total RNA purified from the yeast lysates is measured optically. The efficiency of RNA recovery is estimated by measuring the recovery of a known amount of nonyeast RNA (in our case, Arabidopsis thaliana LSM1) added to the lysate. The reverse transcription and qPCR stages are standardized by comparison with known amounts of in vitro transcribed RNAs with the same sequence, mixed with total RNA purified from cells that do not express the reporter genes. The results from this procedure are compared with numbers obtained by visual inspection of individual transcripts detected by FISH in large numbers of single cells. The details of the various procedures are given in the Supplemental Material.
FIGURE 3.
FIGURE 3.
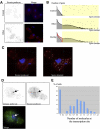
Image based measurement of Ribo1 RNAs in individual yeast cells. (A) Detection of single molecules of the Ribo1 reporter RNA in TetOFF strains. Control strain lacking the reporter gene (top), or expressing Ribo1 (bottom) were hybridized in situ with the exonic probe set. Right panels display maximal image projections of the RNA signal (red) overlayed with the nuclei (blue). Each field is a projection of a 3D stack (6 × 6 × 6 μm). (B) Efficiency of RNA detection. Histograms of the number of spots versus spot contrast across an entire 3D stack (63 × 63 × 6 μm) are shown for control and Ribo1 expressing cells. The area shaded in yellow corresponds to the spots included in the analysis after thresholding. Bottom panel: overlay of the two histograms revealing the amount of Ribo1 mRNA molecules lost by the thresholding procedure (red area; <20% of the total number of spots identified) (C) Maximal image projection (3.5 × 3.5 × 6 μm) of a cell with the spots identified indicated with small spheres on the right panel. (D) Single plane of a Ribo1 expressing cell with both the exonic (Cy5, green) and the intronic signals (Cy3, red). Blue: Dapi. Each field is 3.6 × 3.6 μm. Arrows indicate the position of the intronic focus that identifies the putative transcription site. (E) Histogram plotting the number of molecules of Ribo1 RNA, identified with the exonic probe set, at the intronic foci (putative transcription site). Cells with zero molecules have no signal for the intronic pool of probe.
FIGURE 4.
FIGURE 4.
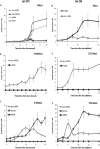
Kinetics of repression and turnover of Ribo1 reporter transcripts using the RiboSys tetOFF strains. The tetOFF strains with intron-containing Ribo1 or intonless ILRibo1 (A,B), mutant 5′SSRibo1 (C), or mutant 3′SSRibo1 (D) reporters were grown in SD minimal medium with doxycycline (4 μg/ mL) added at time 0 to initiate repression of transcription. (A) Northern blot analysis of Ribo1 and ILRibo1 reporters showing relative mRNA levels following repression. Apparent half-lives of the reporter transcripts are shown below the blot. (B–D) Repression of RiboSys reporters showing relative abundance (log2) of the Ribo1 and ILRibo1 mRNAs (B), 5′SSRibo1 pre-mRNA (C), and 3′SSRibo1 lariat-exon2 intermediate (D) assayed by RT-qPCR of the 3′SS region (3′SS) or using lariat-specific RT-qPCR (LAR). The apparent half-lives, calculated from the linear parts of the curves, are displayed.
FIGURE 5.
FIGURE 5.
Kinetics of transcription and splicing of RiboSys reporter transcripts in tetOFF and tetON strains. A time course is shown of the levels of pre-mRNA (pre), lariat intron-exon2 splicing intermediate (lar-exon2; measured by 3′SS assay and subtracting the amount of unspliced pre-mRNA) (see Fig.1), exon2 (exon) and spliced mRNA in copies per cell. (A–C) tetOFF cultures were grown in SD medium to midlog phase (OD600 0.5) with transcription repressed by the presence of dox (4 μg/ mL). After 90 min of transcriptional repression, cells were harvested by centrifugation and resuspended into medium without dox (time 0). (D–F) tetON cultures (YIK91 with various Ribo1 reporters integrated at the his3 locus) were grown in SD minimal medium (-trp) with doxycline (4 μg/ mL) present to induce transcription. (A,D) Ribo1; (B,E) 5′SSRibo1; and (C,F) 3′SSRibo1. In each panel the data represent three experiments, each assayed in triplicate, and error bars indicate standard deviation.
FIGURE 6.
FIGURE 6.
3′-End formation and deadenylation (A) Flow diagram of the PCR-based method that was applied to analyze transcript 3′-end formation. In a first step a 5′ phosphorylated DNA linker oligonucleotide is ligated by T4 RNA ligase to available 3′-OH groups. This is followed by first-strand cDNA synthesis using the linker-specific RevB oligonucleotide and subsequent PCR analysis. The obtained PCR product is further amplified by nested PCR using RevA and PGK1-B oligonucleotides. The obtained PCR product can be transferred into a plasmid and analyzed by DNA sequencing. Alternatively, the nested PCR can be performed with radioactively labeled oligonucleotides and PCR products can be separated on denaturing polyacrylamide gels. (B) Time course of adenylation/deadenylation following derepression of ILRibo1 and Ribo1 in the tetOFF strain, analyzed as described in A. Radioactive PCR products were resolved on 6% (w/v) polyacrylamide/ 8.3 M urea gels. The length of the poly(A) tract associated with the PCR products is indicated by numbers. To control for specificity of PCR amplification a minus reverse transcriptase (−RT) control was included. (C) Graph depicting the length of the shortest poly(A) tails observed at individual time points during reporter derepression. Data are the mean of three (− Intron) and four (+ Intron) experiments and error bars represent S.D. Deadenylation rates were derived from initial linear phases of poly(A) shortening.
FIGURE 7.
FIGURE 7.
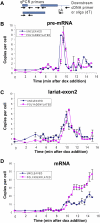
Kinetic analysis of splicing and 3′-end formation of Ribo1 transcripts demonstrates cotranscriptional splicing. RNA, sampled at 30-sec intervals during a time course of induction of Ribo1, was reverse transcribed with either oligo (dT) to copy cleaved and polyadenylated transcripts, or with a primer downstream of the mapped cleavage/poly(A) sites to copy uncleaved transcripts (there is a short delay between transcription through the poly(A) site and 3′-end cleavage). qPCR was performed to measure unspliced and spliced transcripts. (A) Schematic of the assay, showing the approximate positions of primers used for qPCR of unspliced pre-mRNA (across 5′SS), lariat intron-exon (across 3′SS then subtract the value for pre-mRNA) and spliced mRNA (across exon junction) or used to prime cDNA synthesis. pA indicates the 3′-end cleavage/polyadnylation site. Results are shown for: pre-mRNA (B), lariat intron-exon2 (C), and mRNA (D). As a control, it was demonstrated that no cDNA was produced when oligo (dT)-selected polyadenylated RNA was reverse transcribed using the downstream primer (data not shown).

Similar articles

Cited by

References

    1. Aitken S, Robert MC, Alexander RD, Goryanin I, Bertrand E, Beggs JD 2010. Processivity and coupling in messenger RNA transcription. PLoS ONE 5: e8845 doi: 10.1371/journal.pone.0008845 - PMC - PubMed
    1. Belli G, Gari E, Aldea M, Herrero E 1998a. Functional analysis of yeast essential genes using a promoter-substitution cassette and the tetracycline-regulatable dual expression system. Yeast 14: 1127–1138 - PubMed
    1. Belli G, Gari E, Piedrafita L, Aldea M, Herrero E 1998b. An activator/repressor dual system allows tight tetracycline-regulated gene expression in budding yeast. Nucleic Acids Res 26: 942–947 - PMC - PubMed
    1. Blake WJ, Balazsi G, Kohanski MA, Isaacs FJ, Murphy KF, Kuang Y, Cantor CR, Walt DR, Collins JJ 2006. Phenotypic consequences of promoter-mediated transcriptional noise. Mol Cell 24: 853–865 - PubMed
    1. Boireau S, Maiuri P, Basyuk E, de la Mata M, Knezevich A, Pradet-Balade B, Backer V, Kornblihtt A, Marcello A, Bertrand E 2007. The transcriptional cycle of HIV-1 in real-time and live cells. J Cell Biol 179: 291–304 - PMC - PubMed

Publication types

MeSH terms