. 2010 Nov;136(5):497-513.
doi: 10.1085/jgp.200910347.

Rapid topology probing using fluorescence spectroscopy in planar lipid bilayer: the pore-forming mechanism of the toxin Cry1Aa of Bacillus thuringiensis

Affiliations

Rapid topology probing using fluorescence spectroscopy in planar lipid bilayer: the pore-forming mechanism of the toxin Cry1Aa of Bacillus thuringiensis

Nicolas Groulx et al. J Gen Physiol. 2010 Nov.

Abstract

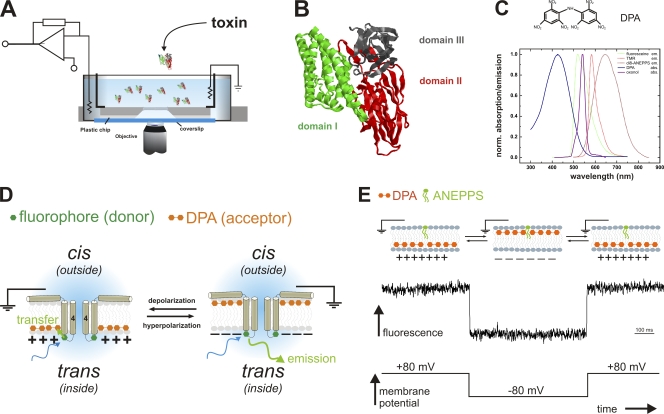
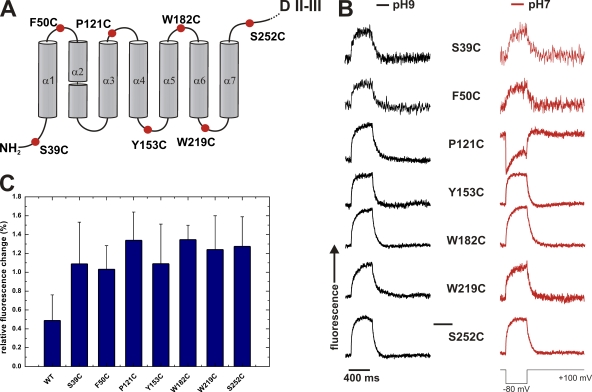
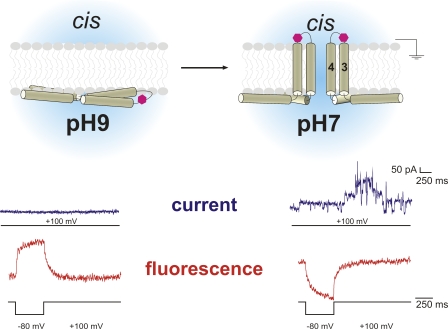
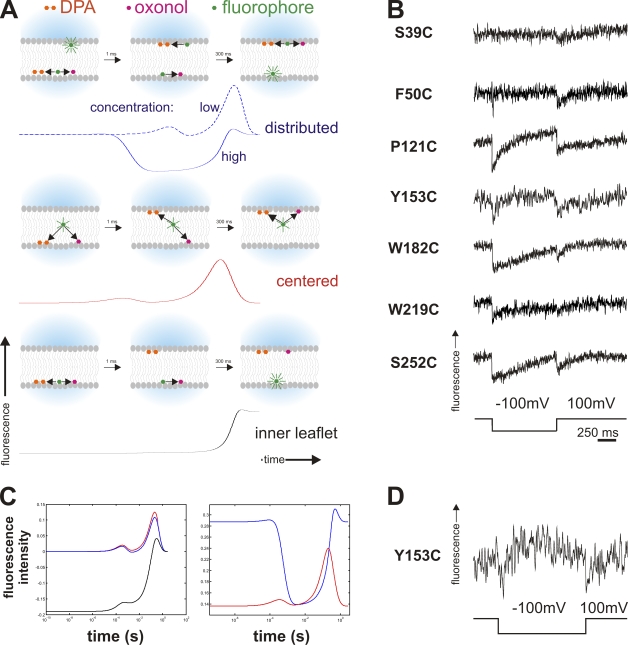
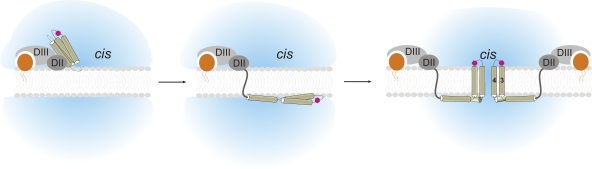
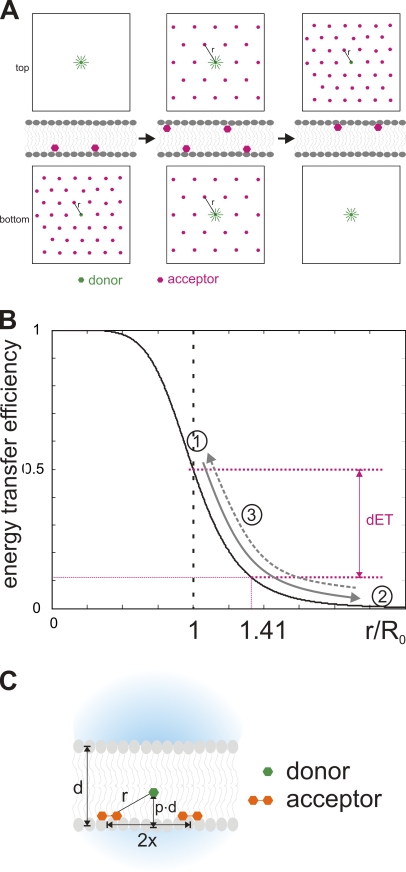
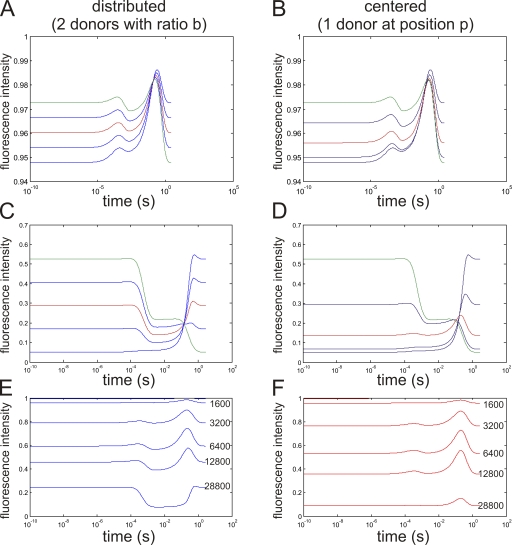
Pore-forming toxins, many of which are pathogenic to humans, are highly dynamic proteins that adopt a different conformation in aqueous solution than in the lipid environment of the host membrane. Consequently, their crystal structures obtained in aqueous environment do not reflect the active conformation in the membrane, making it difficult to deduce the molecular determinants responsible for pore formation. To obtain structural information directly in the membrane, we introduce a fluorescence technique to probe the native topology of pore-forming toxins in planar lipid bilayers and follow their movement during pore formation. Using a Förster resonance energy transfer (FRET) approach between site-directedly labeled proteins and an absorbing compound (dipicrylamine) in the membrane, we simultaneously recorded the electrical current and fluorescence emission in horizontal planar lipid bilayers formed in plastic chips. With this system, we mapped the topology of the pore-forming domain of Cry1Aa, a biological pesticide from Bacillus thuringiensis, by determining the location of the loops between its seven α helices. We found that the majority of the toxins initially traverse from the cis to the trans leaflet of the membrane. Comparing the topologies of Cry1Aa in the active and inactive state in order to identify the pore-forming mechanism, we established that only the α3-α4 hairpin translocates through the membrane from the trans to the cis leaflet, whereas all other positions remained constant. As toxins are highly dynamic proteins, populations that differ in conformation might be present simultaneously. To test the presence of different populations, we designed double-FRET experiments, where a single donor interacts with two acceptors with very different kinetics (dipicrylamine and oxonol). Due to the nonlinear response of FRET and the dynamic change of the acceptor distribution, we can deduce the distribution of the acceptors in the membrane from the time course of the donor fluorescence. We found that Cry1Aa is present on both membrane leaflets.


Figures

Figure 1.
Figure 1.
Fluorescence topology assay. (A) Horizontal planar lipid bilayer configuration for optical access: The bilayer is formed in the aperture (Ø = 80–200 µm) of a small plastic chip (gray). The chip with access channels on the bottom is placed on a glass coverslip, facilitating the bilayer to be imaged with a high NA objective. Electrical currents are recorded with a patch-clamp amplifier. The configuration is mounted on the stage of an inverted microscope. (B) Structure of Cry1Aa (Grochulski et al., 1995). The three domains are shown in green (I), red (II), and gray (III). (C) Structure of dipicrylamine (DPA, top), absorption spectrum of DPA (blue), and emission spectra of tetramethylrhodamine (TMR, red), fluorescein (green) and di-8-ANEPPS (brown). DPA is a negatively charged amphiphatic compound, which absorbs in the visible spectral range. It overlaps with TMR as well as with fluorescein emission wavelengths with an R0 of 35 and 45 Å, respectively. (D) “Umbrella” model and DPA assay. According to the umbrella model, the helices 4 and 5 translocate through the membrane and form the ion-conducting pore. With the DPA assay, we can detect the location of a labeled residue (green hexagon) in the toxin by depolarizing and hyperpolarizing the membrane, and thereby moving the DPA (double orange hexagon) from one leaflet to the other. It only comes to energy transfer (and thus reduced donor fluorescence) if the DPA and the fluorophore are located on the same side of the membrane (see text for details). (E) Control experiment with a membrane-fixed dye. Di-8-ANEPPS inserts into the membrane between the headgroups. Due to its long hydrophobic tail, it cannot translocate to the inner leaflet. In response to a hyperpolarizing voltage pulse (bottom), the DPA moves to the outer leaflet close to the fluorophores resulting in energy transfer and reduced fluorescence (center). Upon returning the voltage, the signal recovers. Please note that the fluorophore is opposite to D.
Figure 2.
Figure 2.
FRET signals of Cry1Aa mutants. (A) Position of cysteine mutants of domain I. Mutants in every loop were investigated except the α2–α3 loop, as mutants in this loop did not express. (B) Fluorescence traces (TMR) of the mutants in A. Fluorescence traces were taken for a hyperpolarizing pulse (+100 mV/−80 mV/+100 mV) at pH 9.0 (black traces) and after exchange to pH 7.0 (red traces). (C) Relative fluorescence changes (dF/F; mean ± SD) of the cysteine mutants in A.
Figure 3.
Figure 3.
Translocation of the α3–α4 hairpin. Results for the T122C-R131E mutant. The fluorophore translocates through the membrane upon activation by pH change. The fluorescence signal (red) reverses as a response to a negative pulse (+100 mV/−80 mV/+100 mV), and pore formation is observed after pH change. Pore formation (blue, 100 mV) is observed only at pH 7.0. Considering that the other positions are located at the intracellular leaflet, we suggest a model for pore formation as depicted here (top). The entire domain I translocates to the internal leaflet. Subsequently, helices α3 and α4 reach through the membrane and form the ion-conducting pore from the internal side. The magenta hexagon depicts the fluorophore attached to the α3–α4 loop. Two toxins are shown on the right as it is thought that toxins oligomerize for pore formation. Please note that the pulse protocols for the current and fluorescence traces are not identical. Currents are shown only from +100 mV.
Figure 4.
Figure 4.
Confocal z-scan of labeled toxin in the bilayer. Confocal z-scans through a bilayer after incubation with labeled toxin. The fluorescence was concentrated to the bilayer after rigorous washing of the toxin as described in the Materials and methods. In red, the “point spread function” (psf) is shown. It was determined with a 1-µm fluorescent bead.
Figure 5.
Figure 5.
Double FRET experiments. (A) Timeline of double FRET in response to a hyperpolarizing pulse. Depicted are the principle states (as cartoons) and respective simulated fluorescence double FRET signals below for high acceptor concentration for the instances where the fluorophores are distributed between the two leaflets (top), located close to the center (center), or located in just one leaflet (bottom). Black arrows indicate energy transfer between toxin (fluorophore) and acceptor (oxonol and DPA) for close or medium distance. While in the centered case, the fluorescence will show two transients (on a logarithmic scale) during the movement of the acceptors, distributed toxins will lead to a transient fluorescence decrease while fluorophores on both sides are transferring energy to oxonol or DPA. A fluorophore located on only one side will lead to a monotonous increase as the acceptors move away. For distributed donors, the fluorescence response for low acceptor concentrations is shown as a dashed line for comparison (see text for details). (B) Results of the double FRET experiments for the cysteine mutants (Fig. 2 A). The traces show a double-negative transient as a response to a depolarizing pulse. (C) Simulated fluorescence response (semi-logarithmic scale) of toxins located close to the center (red), distributed between both leaflets (blue), and located on only one side (black) for a low (6,400 acceptors/µm2, left) and high (22,300 acceptors/µm2, right) concentration in response to a hyperpolarizing pulse. The negative transient in the fluorescence response for distributed toxins occurs only at high concentrations. (D) Trace of double FRET of Y153C where negative and positive transients are visible. This occurs at intermediate acceptor concentrations.
Figure 6.
Figure 6.
The proposed mechanism of pore formation. The Cry1Aa toxin first binds to the membrane-bound receptor with domains II and III. In the subsequent step, the α-helical domain I unfolds and transits to the internal (trans) leaflet. For pore formation to occur, the α3–α4 hairpin inserts into the membrane and reaches to the other side. Several toxins oligomerize in order to form the water-filled pore.
Figure 7.
Figure 7.
Transient concentration decrease during translocation. (A) Schematic of the dynamics of acceptor distribution during the translocation process. At positive potential (inside), the negatively charged acceptors are all in the inner leaflet (left). Once the potential reverses to negative, they exponentially relocate to the outer leaflet. At some time during the translocation process, the concentration on both sides is equal (center). Now the mean distance to the acceptor r(t) is 1.41 times longer than initially (inner leaflet). In the new steady state (right), all acceptors are in the outer leaflet, and the situation is inverted to the initial one. (B) Relation between energy transfer efficiency and distance between donor and acceptor. The distance is a function of the concentration of the acceptors in the membrane. Numbers indicate distances (and ET) at the initial state for the inner (1) and outer (2) leaflet, as well as at equal concentrations for both leaflets (3), assuming the concentration is such that the initial value of r(t) = R0. The arrows indicate how the distance and ET change during a voltage pulse (dynamic fluorescence response) for the inner (solid) and outer (dashed) leaflet. dET indicates the difference in energy transfer for the donors in the inner leaflet between initial (1) and equal state (3). A positive transient is generated as a result of the change of ET between (1) and (3) being larger than between (2) and (3). (C) Variables used in formulas: d, thickness of the bilayer; r, distance between donor and acceptor; 2x, mean distance between two acceptors in one leaflet; p, fraction of the bilayer at which the fluorophore is located.
Figure 8.
Figure 8.
Simulated double FRET responses. Simulated fluorescence traces (semi-logarithmic scale) for donors distributed between both leaflets (A, C, and E) and donors located at a fraction p of the membrane (B, D, and F). (A and B) Concentration of 1,600 acceptors/µm2 with a distribution between both leaflets of b/(1 − b) or located at a position p in the bilayer. The red curve indicates b = 0.5 (equal distribution) or p = 0.5 (center of the bilayer), respectively. (C and D) Same as A and B, but with a concentration of 22,300 acceptors/µm2. (E and F) b or p = 0.5, with increasing concentrations x acceptors/µm2 (x as indicated).

Similar articles

Cited by

References

    1. Akiba T., Abe Y., Kitada S., Kusaka Y., Ito A., Ichimatsu T., Katayama H., Akao T., Higuchi K., Mizuki E., et al. 2008. Crystal structure of the parasporin-2 bacillus thuringiensis toxin that recognizes cancer cells. J. Mol. Biol. 386:121–133 10.1016/j.jmb.2008.12.002 - DOI - PubMed
    1. Aronson A.I., Wu D., Zhang C. 1995. Mutagenesis of specificity and toxicity regions of a Bacillus thuringiensis protoxin gene. J. Bacteriol. 177:4059–4065 - PMC - PubMed
    1. Bah A., Van F.K., Brousseau R., Masson L. 2004. The Bacillus thuringiensis Cry1Aa toxin: effects of trypsin and chymotrypsin site mutations on toxicity and stability. J. Invertebr. Pathol. 85:120–127 10.1016/j.jip.2004.02.002 - DOI - PubMed
    1. Blunck R., Starace D.M., Correa A.M., Bezanilla F. 2004. Detecting rearrangements of shaker and NaChBac in real-time with fluorescence spectroscopy in patch-clamped mammalian cells. Biophys. J. 86:3966–3980 10.1529/biophysj.103.034512 - DOI - PMC - PubMed
    1. Boonserm P., Davis P., Ellar D.J., Li J. 2005. Crystal structure of the mosquito-larvicidal toxin Cry4Ba and its biological implications. J. Mol. Biol. 348:363–382 10.1016/j.jmb.2005.02.013 - DOI - PubMed

Publication types

MeSH terms