Origin of basal activity in mammalian olfactory receptor neurons
- PMID: 20974772
- PMCID: PMC2964517
- DOI: 10.1085/jgp.201010528
Origin of basal activity in mammalian olfactory receptor neurons
Abstract
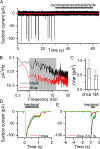
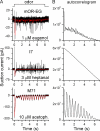
Mammalian odorant receptors form a large, diverse group of G protein-coupled receptors that determine the sensitivity and response profile of olfactory receptor neurons. But little is known if odorant receptors control basal and also stimulus-induced cellular properties of olfactory receptor neurons other than ligand specificity. This study demonstrates that different odorant receptors have varying degrees of basal activity, which drives concomitant receptor current fluctuations and basal action potential firing. This basal activity can be suppressed by odorants functioning as inverse agonists. Furthermore, odorant-stimulated olfactory receptor neurons expressing different odorant receptors can have strikingly different response patterns in the later phases of prolonged stimulation. Thus, the influence of odorant receptor choice on response characteristics is much more complex than previously thought, which has important consequences on odor coding and odor information transfer to the brain.
Figures


Similar articles
-
Spontaneous and sensory-evoked activity in mouse olfactory sensory neurons with defined odorant receptors.J Neurophysiol. 2013 Jul;110(1):55-62. doi: 10.1152/jn.00910.2012. Epub 2013 Apr 17. J Neurophysiol. 2013. PMID: 23596334 Free PMC article.
-
Suppression of odorant responses by odorants in olfactory receptor cells.Science. 1994 Jul 1;265(5168):118-20. doi: 10.1126/science.8016645. Science. 1994. PMID: 8016645
-
Functional identification and reconstitution of an odorant receptor in single olfactory neurons.Proc Natl Acad Sci U S A. 1999 Mar 30;96(7):4040-5. doi: 10.1073/pnas.96.7.4040. Proc Natl Acad Sci U S A. 1999. PMID: 10097159 Free PMC article.
-
The olfactory bulb: coding and processing of odor molecule information.Science. 1999 Oct 22;286(5440):711-5. doi: 10.1126/science.286.5440.711. Science. 1999. PMID: 10531048 Review.
-
Molecular and cellular basis of human olfaction.Chem Biodivers. 2004 Dec;1(12):1857-69. doi: 10.1002/cbdv.200490142. Chem Biodivers. 2004. PMID: 17191824 Review.
Cited by
-
Antagonistic interactions between odorants alter human odor perception.Curr Biol. 2023 Jun 5;33(11):2235-2245.e4. doi: 10.1016/j.cub.2023.04.072. Epub 2023 May 22. Curr Biol. 2023. PMID: 37220745 Free PMC article.
-
Activity-dependent formation of the topographic map and the critical period in the development of mammalian olfactory system.Genesis. 2024 Feb;62(1):e23586. doi: 10.1002/dvg.23586. Genesis. 2024. PMID: 38593162 Free PMC article. Review.
-
Circuit formation and function in the olfactory bulb of mice with reduced spontaneous afferent activity.J Neurosci. 2015 Jan 7;35(1):146-60. doi: 10.1523/JNEUROSCI.0613-14.2015. J Neurosci. 2015. PMID: 25568110 Free PMC article.
-
From molecule to mind: an integrative perspective on odor intensity.Trends Neurosci. 2014 Aug;37(8):443-54. doi: 10.1016/j.tins.2014.05.005. Epub 2014 Jun 17. Trends Neurosci. 2014. PMID: 24950600 Free PMC article. Review.
-
Topographic organization in the olfactory bulb.Cell Tissue Res. 2021 Jan;383(1):457-472. doi: 10.1007/s00441-020-03348-w. Epub 2021 Jan 6. Cell Tissue Res. 2021. PMID: 33404841 Free PMC article. Review.
References
-
- Bozza T., Vassalli A., Fuss S., Zhang J.J., Weiland B., Pacifico R., Feinstein P., Mombaerts P. 2009. Mapping of class I and class II odorant receptors to glomerular domains by two distinct types of olfactory sensory neurons in the mouse. Neuron. 61:220–233 10.1016/j.neuron.2008.11.010 - DOI - PMC - PubMed
Publication types
MeSH terms
Substances
Grants and funding
LinkOut - more resources
Full Text Sources

