. 2011 Jan 7;286(1):634-48.
doi: 10.1074/jbc.M110.159202. Epub 2010 Oct 25.

Structural modeling and electron paramagnetic resonance spectroscopy of the human Na+/H+ exchanger isoform 1, NHE1

Affiliations

Structural modeling and electron paramagnetic resonance spectroscopy of the human Na+/H+ exchanger isoform 1, NHE1

Eva B Nygaard et al. J Biol Chem. .

Abstract

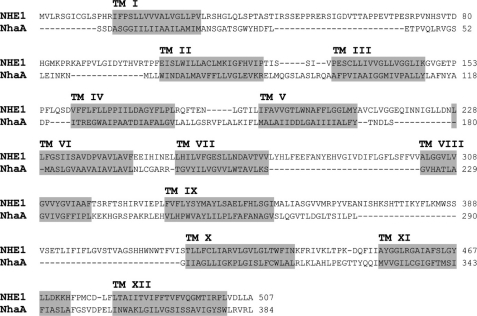
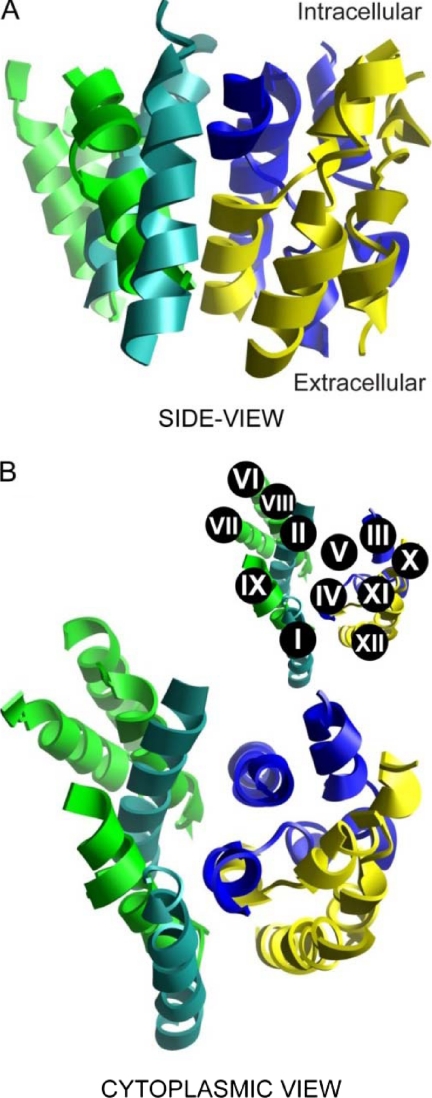
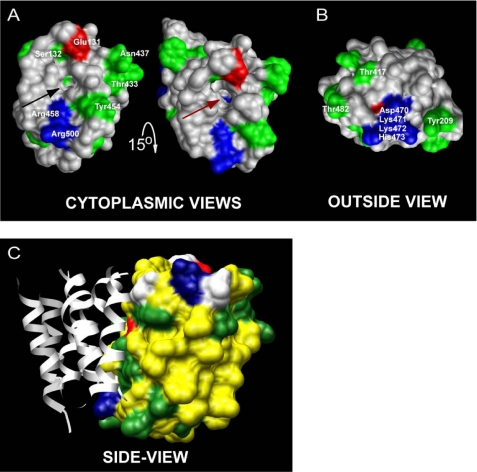
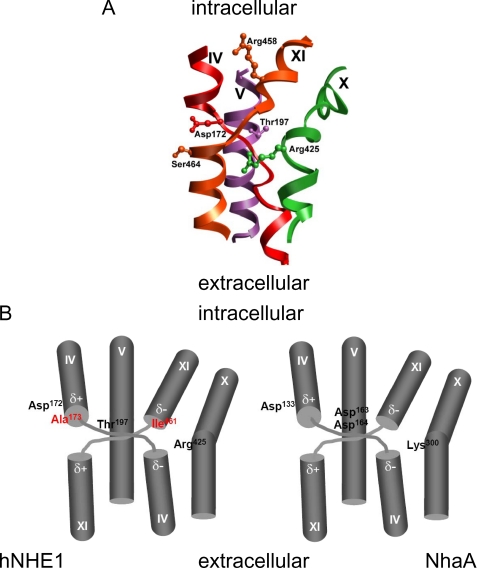
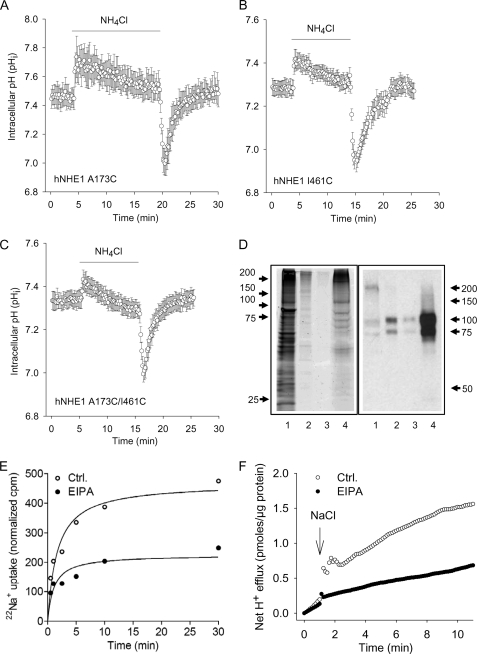
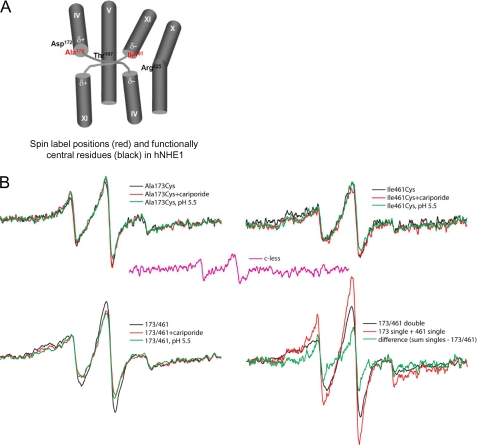
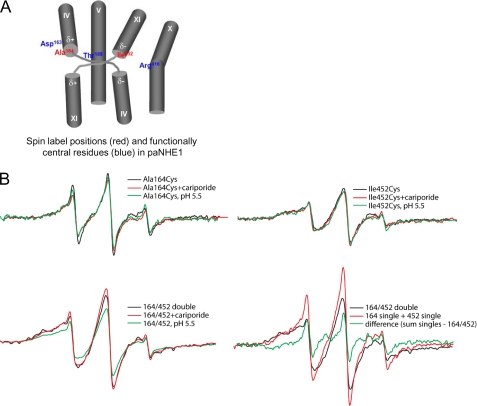
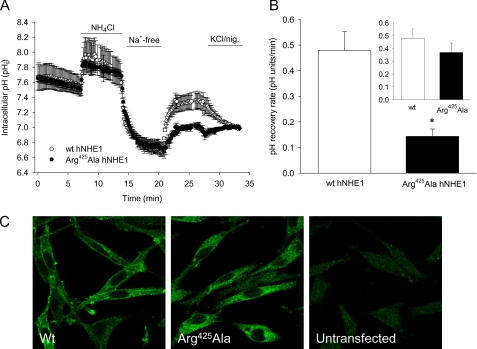
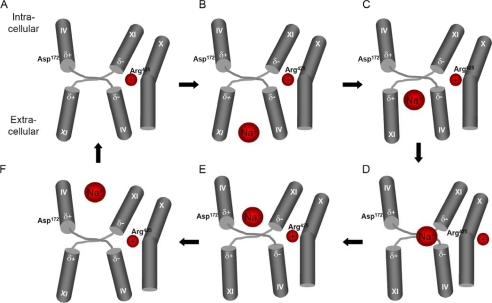
We previously presented evidence that transmembrane domain (TM) IV and TM X-XI are important for inhibitor binding and ion transport by the human Na(+)/H(+) exchanger, hNHE1 (Pedersen, S. F., King, S. A., Nygaard, E. B., Rigor, R. R., and Cala, P. M. (2007) J. Biol. Chem. 282, 19716-19727). Here, we present a structural model of the transmembrane part of hNHE1 that further supports this conclusion. The hNHE1 model was based on the crystal structure of the Escherichia coli Na(+)/H(+) antiporter, NhaA, and previous cysteine scanning accessibility studies of hNHE1 and was validated by EPR spectroscopy of spin labels in TM IV and TM XI, as well as by functional analysis of hNHE1 mutants. Removal of all endogenous cysteines in hNHE1, introduction of the mutations A173C (TM IV) and/or I461C (TM XI), and expression of the constructs in mammalian cells resulted in functional hNHE1 proteins. The distance between these spin labels was ∼15 A, confirming that TM IV and TM XI are in close proximity. This distance was decreased both at pH 5.1 and in the presence of the NHE1 inhibitor cariporide. A similar TM IV·TM XI distance and a similar change upon a pH shift were found for the cariporide-insensitive Pleuronectes americanus (pa) NHE1; however, in paNHE1, cariporide had no effect on TM IV·TM XI distance. The central role of the TM IV·TM XI arrangement was confirmed by the partial loss of function upon mutation of Arg(425), which the model predicts stabilizes this arrangement. The data are consistent with a role for TM IV and TM XI rearrangements coincident with ion translocation and inhibitor binding by hNHE1.


Figures

FIGURE 1.
FIGURE 1.
Alignment of hNHE1 and NhaA. hNHE1 was predicted to be similar to the structure of NhaA by a number of well established secondary structure and fold recognition methods at the MetaServer (25). The alignment of the sequences (14% identical residues and 23% conserved substitutions in the aligned regions) is from the joint evaluation of the outcome by the 3D-Jury system at the same server and by manual adjustments as detailed under “Experimental Procedures.” The predicted TM helices of NHE1 are shaded in gray (note the lack of fit for some loop regions).
FIGURE 2.
FIGURE 2.
Full structural model of the N-terminal region of hNHE1. The structure model is based on the known structure of the smaller bacterial Na+/H+ exchanger NhaA. The shown representations include the transmembrane domains only (residues 15–31 (TM I), 104–123 (TM II), 130–147 (TM III), 160–179 (TM IV), 191–209 (TM V), 228–246 (TM VI), 255–272 (TM VII), 300–317 (TM VIII), 333–353 (TM IX), 417–437 (TM X), 453–473 (TM XI), and 481–502 (TM XII)) and exclude connecting loops and terminal extensions. The color code used is Turquoise for TMs I and II; dark blue for TMs III, IV and V; green for TMs VI, VII, VIII, and IX; and yellow for TMs X, XI and XII. A, side view of the hNHE1 structure in the plane of the lipid bilayer. B, cytoplasmic view. The inset shows the numbering of the individual helices.
FIGURE 3.
FIGURE 3.
Solid surface structure representations of TMs III, IV, V, X, XI, and XII (referred to as the catalytical core in the text) in the hNHE1 model. Positively charged residues are shown in blue, negatively charged residues are in red, and polar residues are in green. A, the cytoplasmic view (the structure on the right in A is tilted 15° downwards compared with the structure on the left) reveals a cavity (arrows) in the structure that reaches down to Arg425 (brown arrow). Several charged and polar residues that may be involved in the ion translocation are located near this cavity. These include Arg458 and Arg500 (positively charged); Glu131 (negatively charged); and Ser132, Thr433, Asn437, and Tyr454 (polar). B, the face of the protein exposed to the outside of the cell does not exhibit any obvious cavity in the structure. However, a cluster of charged residues (Asp470, Lys471, Lys472, and His473) at the end of TM XI and also some scattered polar residues (e.g. Tyr209, Thr417, and Thr482) are accessible on the outside surface of the transmembrane domain. C, the side view representation shows that primarily hydrophobic side chains (yellow) are pointed into the interior of the lipid bilayer. TMs I, II, VI, VII, VIII, and IX are shown as gray ribbons for orientation (compare with Fig. 2).
FIGURE 4.
FIGURE 4.
Structure of the Na+/H+ exchanger catalytical core. A, the central parts of TM domains IV, V, X, and XI, the presumed catalytical core for hNHE1-catalyzed Na+/H+ exchange, are represented as a ribbon diagram. B, schematic depiction of the central core of NHE1 (left panel) and NhaA (right panel). The amino acid side chains suggested to directly participate in ion translocation are shown. The positions of the main spin labels are shown in red in hNHE1. Note that the characteristic crossover by the extended structures of helices IV and XI results in energetically unfavorable dipole-dipole pairings (dipoles shown as δ+ and δ−) at the ends of the disrupted α-helices.
FIGURE 5.
FIGURE 5.
Functional evaluation of the NHE1 constructs in AP1 cells and liposomes. A–C, regulation of pHi after an acid load in AP1 cells expressing the A173C (A), I461C (B), or A173C/I461C hNHE1 (C). AP1 cells were loaded with 2′,7′-bis-(2-carboxyethyl)-5,6-carboxyfluorescein and mounted on a Zeiss Axiovert S100 microscope. The cells were perfused with nominally HCO3-free HEPES-buffered isotonic Ringer solution that, where indicated by the bar, additionally contained 10 mm NH4Cl. Calibration to pHi was carried out as previously described (12). The data shown are representative of six or seven independent experiments/condition. The rates of pHi recovery, obtained at similar starting pHi values but not normalized to expression levels, were 0.13 ± 0.010 (A173C, n = 7), 0.10 ± 0.0039 (I461C, n = 6), and 0.17 ± 0.0037 (A173C/I461C, n = 6). D, Coomassie Fluor Orange staining and Western blot of the A173C/I461C hNHE1 mutant after purification. Purification, staining, and immunoblotting were carried out as described under “Experimental Procedures.” Coomassie Fluor Orange staining is shown in the left panel, and Western blotting for NHE1 is shown in the right panel. Lane 1, the solubilized membrane fraction before transfer to the Ni2+ column; lane 2, eluate from Ni+ column with Ni+ elution buffer (containing 300 mm imidazole); lane 3, eluate from the CaM column with CaM elution buffer; lane 4, purified A173C/I461C hNHE1 sample obtained from the concentration of the sample shown in lane 3. E and F, 22Na+ uptake and H+ flux by hNHE1 reconstituted in liposomes. E, 22Na+ uptake was measured over time in hNHE1 liposome suspensions. The assays were performed in high osmolarity buffered sucrose solution and initiated by the addition of tracer 22Na+ containing solution. F, hNHE1 liposomes were suspended in a poorly buffered KCl medium, monitored with a pH microelectrode in the external bath solution, and expressed as H+ flux. The H+ flux reaction was initiated by adding 10 μl of 4 m NaCl solution at the time indicated. Where indicated, the liposomes were suspended in EVM in the presence of 50 μm EIPA. The difference caused by EIPA represents the NHE1-specific flux. Ctrl., control.
FIGURE 6.
FIGURE 6.
EPR analyses of hNHE1 A173C, I461C, and A173C/I461C. The spectra were collected from samples of purified hNHE1 in CaM elution buffer (pH 7.5) containing 0.01% DDM, and the protein concentration (normalized to 20 μm spin for singles, 40 μm for double and sum of singles) is normalized to the same value for all samples. A, spin label positions (red) and functionally central residues (black) in hNHE1. See text for details. B, top panels, effects of cariporide (0.1 mm) and low pH (5.1) on the EPR spectra of samples containing a spin label at position A173C or I461C, respectively. Bottom panels, effects of cariporide (0.1 mm) and low pH (5.1) on the EPR spectra of double labeled A173C/I461C samples, and the signal from the double labeled sample compared with the sum of singles. Center in pink, signal from the cysteine-less hNHE1, which was incubated with spin label and examined at a concentration similar to the preparations containing a single- or double-Cys substitution (∼20 μm NHE1). This background signal was subtracted from all spectra in panels A–D. Each spectrum shows a scan over a field of 100 G.
FIGURE 7.
FIGURE 7.
EPR analyses of paNHE1 A164C, I452C, and A164C/I452C. The spectra were collected from samples of purified paNHE1 in PBS buffer (pH 7.5) containing 0.01% DDM, and the protein concentration (normalized to 20 μm spin for singles, 40 μm for double and sum of singles) is normalized to the same value for all samples. A, spin label positions (red) and functionally central residues (blue) in paNHE1. See text for details. B, top panels, effects of cariporide (1 mm) and low pH (5.1) on the EPR spectra of samples containing a spin label at position A164C or I452C, respectively. Bottom panels, effects of cariporide (1 mm) and low pH (5.1) on the EPR spectra of double labeled A164C/I452C samples and the signal from the double labeled sample compared with the sum of singles. The residual signal was subtracted from all spectra. Each spectrum shows a scan over a field of 100 G.
FIGURE 8.
FIGURE 8.
Effect of R425A mutation on hNHE1 expression, localization, and function. A, recovery of pHi after an NH4Cl prepulse-induced acid load in AP-1 cells stably transfected with WT hNHE1 (open circles) or R425A hNHE1 (filled circles). The experiments were carried out essentially as described in the legend to Fig. 5, except that the measurements were carried out in a PTI fluorescence spectrophotometer. Where indicated, HEPES-buffered isotonic Ringer solution was replaced with NH4Cl-containing and Na+-free Ringer solution, respectively, as indicated by the bars. The graphs shown are representative of at least three independent experiments per condition. B, summary of the experiments shown in A, showing the initial rate of pHi recovery for WT hNHE1 and R425A hNHE1, respectively. The inset shows the pHi recovery rates corrected for the relative levels of WT and R425A hNHE1 in the plasma membrane, calculated as described under “Experimental Procedures.” C, confocal images of AP-1 cells transfected with WT hNHE1, R425A hNHE1, or untransfected as indicated. The cells were paraformaldehyde-fixed, labeled for NHE1 followed by secondary, Alexa488-coupled antibody, and imaged using a Leica confocal microscope as detailed under “Experimental Procedures.” The images shown are representative of at least three independent experiments per condition.
FIGURE 9.
FIGURE 9.
Tentative working model of ion translocation in the catalytic core of NHE1. The figure depicts possible conformational changes in the TM IV·TM XI crossover arrangement during NHE1 ion translocation induced by an acidic pH change. A, charge compensation from Arg425 located in TM X stabilizes the energetically unfavorable negative/negative and positive/positive dipole-dipole pairings in the arrangement of the TM IV·TM XI helices. B, an acidic pH change results in alteration of the protonation state of the region of TM IX (not shown) located at the entrance of the proposed funnel, eliciting a conformational change in TM IX, which causes a direct contact between TM IV and TM IX (not shown). This rearrangement of TM IV results in a reorientation of TM IV and TM XI such that a Na+-binding site is exposed to the extracellular space. C–F, binding of Na+ causes a charge imbalance, triggering a movement of the TM IV and TM XI helices, exposing Na+ to the cytoplasm. The release of Na+ results in protonation of the Na+-binding site, causing a conformational change leading back to the original arrangement of TM IV and TM XI.

Comment in

Similar articles

Cited by

References

    1. Orlowski J., Grinstein S. (2004) Pflugers Arch. 447, 549–565 - PubMed
    1. Pedersen S. F., O'Donnell M. E., Anderson S. E., Cala P. M. (2006) Am. J. Physiol. Regul. Integr. Comp. Physiol. 291, R1–R25 - PubMed
    1. Wakabayashi S., Pang T., Su X., Shigekawa M. (2000) J. Biol. Chem. 275, 7942–7949 - PubMed
    1. McLean L. A., Zia S., Gorin F. A., Cala P. M. (1999) Am. J. Physiol. 276, C1025–C1037 - PubMed
    1. Pedersen S. F., King S. A., Rigor R. R., Zhuang Z., Cala P. M. (2003) Bull. Mt. Desert Island 42, 38–39

Publication types

MeSH terms

LinkOut - more resources