. 2010 Dec 31;285(53):42075-85.
doi: 10.1074/jbc.M110.172841. Epub 2010 Oct 25.

Decorin antagonizes Met receptor activity and down-regulates {beta}-catenin and Myc levels

Affiliations

Decorin antagonizes Met receptor activity and down-regulates {beta}-catenin and Myc levels

Simone Buraschi et al. J Biol Chem. .

Abstract

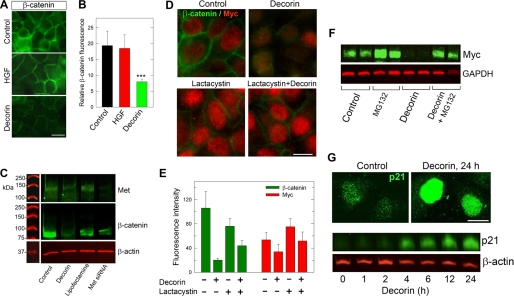
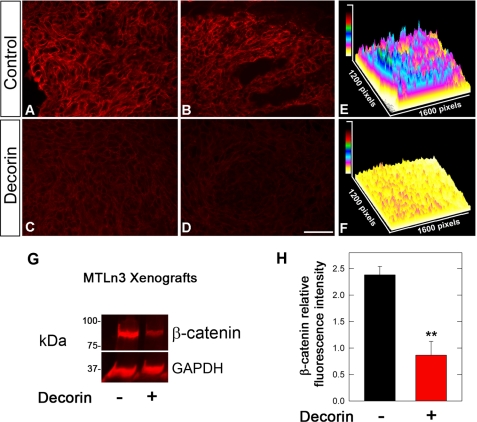
A theme emerging during the past few years is that members of the small leucine-rich proteoglycan gene family affect cell growth by interacting with multiple receptor tyrosine kinases (RTKs), mostly by a physical down-regulation of the receptors, thereby depriving tumor cells of pro-survival signals. Decorin binds and down-regulates several RTKs, including Met, the receptor for hepatocyte growth factor. Here we demonstrate that decorin blocks several biological activities mediated by the Met signaling axis, including cell scatter, evasion, and migration. These effects were mediated by a profound down-regulation of noncanonical β-catenin levels. In addition, Myc, a downstream target of β-catenin, was markedly down-regulated by decorin, whereas phosphorylation of Myc at threonine 58 was markedly induced. The latter is known to destabilize Myc and target it for proteasomal degradation. We also discovered that systemic delivery of decorin using three distinct tumor xenograft models caused down-regulation of Met and a concurrent suppression of β-catenin and Myc levels. We found that decorin protein core labeled with the near infrared dye IR800 specifically targeted the tumor cells expressing Met. Even 68-h post-injection, decorin was found to reside within the tumor xenografts with little or no binding to other tissues. Collectively, our results indicate a role for a secreted proteoglycan in suppressing the expression of key oncogenic factors required for tumor progression.


Figures

FIGURE 1.
FIGURE 1.
Decorin bioactivity in MDCK cells. A, immunoblot of MDCK cells treated with or without decorin (100 nm) for 6 h. Cell lysates were separated by 8% SDS-PAGE and immunoblotted for Met and β-catenin with GAPDH as loading control. Proteins were visualized with IR-Dye-labeled secondary antibodies and quantified using Odyssey Infrared Imaging system (Li-Cor). B–D, immunofluorescence images of MDCK cell untreated (control) or treated with either HGF (50 ng/ml, ∼0.71 nm) or decorin (100 nm) for 6 h. E–H, decorin attenuates HGF/SF induced MDCK cell scattering after 14-h incubation with (F and H) or without (E and G) 500 nm decorin in the presence (G and H) or absence (E and F) of HGF (0.71 nm). I, quantification of scattered cells after 14 h of HGF and decorin treatment. The values represent the mean ± S.E. (n = 40 each, ***, p < 0.001).
FIGURE 2.
FIGURE 2.
Decorin attenuates the HGF-evoked evasion of MDCK cells from Matrigel drops. Evasion of MDCK cells after 24 h incubation with (B and D) or without (A and C) decorin (500 nm) in the presence (C and D) or absence (A and B) of HGF (0.71 nm) stimulation. The dotted lines indicate the edge of the Matrigel drops. E, quantification of cells evaded from each Matrigel drop. The values represent the mean ± S.E. (n = 45 ***, p < 0.001).
FIGURE 3.
FIGURE 3.
Decorin inhibits migration via the Met receptor and evokes caveolin-mediated internalization of Met. A, motility assay perfomed with a monolayer of HeLa cells scratched to cause a wound. Cells were treated for 18 h with 500 nm decorin or 0.71 nm HGF. Where indicated, 10 μg/ml H9786, a Met-blocking antibody, was added 30 min before treatment. Representative photos are shown. Bar, 60 μm. B, confocal images showing the Met receptor (green) and caveolin (red) in HeLa cells treated with or without 500 nm decorin or 0.71 nm HGF for 5 h. C, HeLa cells under the same treatment as shown in B, but stained for Met (green) and clathrin (red). All images were taken with the same exposure and gain. White arrows indicate co-localization. Bar, 10 μm.
FIGURE 4.
FIGURE 4.
Decorin down-regulates β-catenin and Myc proteins. A, immunofluorescence images showing β-catenin epitopes in HeLa cells treated with either decorin (500 nm) for 5 h, or HGF (0.71 nm) for 30 min. B, quantification of fluorescent intensity with values representing means with their upper 95% confidence intervals (n = 30, ***, p < 0.001). C, representative immunoblot of Met and β-catenin levels in HeLa cells, which were transfected for 48 h with specific siRNAs targeting the Met receptor or treated for 24-h with decorin protein core (500 nm); β-actin was used as a loading control. D, fluorescence staining of HeLa cells for β-catenin and Myc ± decorin for 1 h. Where indicated, cells were preincubated with lactacystin (10 μm) for 30 min. E, quantification of images from D with means ± S.E. (n = 30, ***, p < 0.001). F, immunoblot of Myc levels after a 6-h treatment with decorin following a 2-h preincubation with MG132 (50 μm). G, fluorescence images of p21 induction after a 24-h decorin treatment (top panels). A representative immunoblot (bottom panel) shows time-dependent induction of p21. Decorin protein core was used at a concentration of 500 nm for all experiments shown.
FIGURE 5.
FIGURE 5.
Decorin induces phosphorylation of Myc at threonine 58 and its accumulation into the nuclei of HeLa cells. A, immunoblotting of HeLa cells treated for the indicated time intervals with decorin (500 nm). The blots were probed with an antibody specific for phosphothreonine 58 (P-T58) Myc, and re-probed with an anti-Myc antibody. The levels of β-actin serve as loading control. We note that to better visualize P-T58 Myc, especially at later time points, the experiments were performed in full-serum in contrast to all other experiments presented in the previous figures. Serum increases the amount of total Myc as shown by detection of Myc even after 24 h of decorin treatment. B, quantification of T58 Myc levels by scanning densitometry of two independent experiments. C–E, immunofluorescence detection of P-T58 Myc. The images were merged using differential contrast microscopy (DIC) to better visualize the cell architecture. Note the progressive accumulation of P-T58 Myc in the nuclei of HeLa cells. The white dots represent non immunoreactive endocytic vesicles and/or other cytoplasmic organelles visualized by DIC. Bar, 20 μm.
FIGURE 6.
FIGURE 6.
Decorin negatively regulates the transcription of critical genes. Quantitative real-time PCR showing transcriptional inhibition of key target genes represented as fold changes normalized to the housekeeping gene ACTB (β-actin). The data were obtained from HeLa cells treated with 500 nm decorin for 24 h prior to lysis and represent the average fold changes as calculated by the double ΔCt method ± S.E. (n = 12, ***, p < 0.001; NS, not significant). For additional information refer to the text.
FIGURE 7.
FIGURE 7.
Systemic delivery of decorin protein core inhibits Met expression in two tumor xenografts. A, bar graph showing inhibition of A431 squamous tumor growth in SCID mice at day 23 of decorin treatment (5 mg/kg). Data represent the mean ± S.E. (n = 8, **, p < 0.01). B, representative immunoblot of A431 tumor lysates showing down-regulation of Met expression following decorin treatment. Tubulin was used as loading control. C and D, same as in A and B using MTLn3 mammary carcinoma xenografts. E-I, detection of Met (green) using immunofluorescence of frozen sections from A431 tumor xenografts of vehicle (control) or decorin-treated mice. All the micrographs were taken using the same exposure and gain. Mice bearing A431 tumor xenografts were treated with intraperitoneal injections of decorin (5 mg/kg) every other day for 26 days. Bar, 250 μm. G and J, three-dimensional surface plots generated with ImageJ software depicting levels of Met expression corresponding to the staining above. The scale bars for signal intensity are included in the top left corner.
FIGURE 8.
FIGURE 8.
Decorin treatment leads to down-regulation of β-catenin in A431 and MTLn3 tumor xenografts. A–D, immunofluorescence images of two control and two decorin-treated A431 tumor xenografts, reacted with anti-β-catenin antibodies. A431 tumors were treated with decorin every other day for 23 days (5 mg/kg) as in Fig. 7. All the micrographs were taken using the same exposure and gain. Bar, 250 μm. E and F, three-dimensional surface plot analyses of immunofluorescence images obtained by staining for β-catenin in control and decorin-treated tumors, respectively. The scale bars for signal intensity are included in the top left corners. G, immunoblot for β-catenin and GAPDH of tumor lysates from MTLn3 mammary carcinoma xenografts grown in SCID mice. The tumors were treated on alternate days after the tumors became palpable with either vehicle (control) or 5 mg/kg human recombinant decorin protein core until the end point as in Fig. 7. The proteins were visualized with near-infrared labeled secondary antibody and measured with the Odyssey software (Li-COR). H, quantification of immunoblots of β-catenin expression normalized to GAPDH, n = 3. Values represent mean ± S.E. (**, p < 0.01).
FIGURE 9.
FIGURE 9.
IR800-labeled decorin protein core targets specifically the human tumor xenografts. A, preinjection scan (white channel), B–D, lateral side scans using pseudocolor intensity map of the same tumor-bearing mouse at various times post-injection, as indicated. The tumor is circled in white. About 100 μg of IR800-labeled decorin protein core was injected via the tail vein. E, ventral view showing liver at 68 h post-injection. F, dorsal view showing kidneys and tumor as indicated at 22 h post-injection. G, isolated organs after 68 h. Bar, 10 mm. H, an example of an isolated tumor xenograft after 68 h of IR800-decorin injection. I, detection of IR800-labeled decorin in kidney and tumor xenograft lysates. Lane 1, Coomassie Blue-prestained protein standards (note that using the infrared detection system the Coomassie Blue-prestained proteins appear as red); lanes 2–6, increasing concentrations of purified IR800-decorin protein core (5, 10, 20, 30, and 40 ng, respectively); lane 7, kidney lysate at 68 h (calculated to correspond to ∼1.4 ng/mg wet weight); lane 8, tumor lysate at 68 h (calculated to correspond to ∼0.64 ng/mg wet weight). SCID mice were subcutaneously injected with 2 × 10⁶ HeLa cells into the upper left dorsal areas, and tumor xenografts were allowed to establish for ∼3 weeks.

Similar articles

Cited by

References

    1. Ramirez F., Rifkin D. B. (2003) Matrix Biol. 22, 101–107 - PubMed
    1. Bateman J. F., Boot-Handford R. P., Lamandé S. R. (2009) Nat. Rev. Genet. 10, 173–183 - PubMed
    1. Iozzo R. V., Murdoch A. D. (1996) FASEB J. 10, 598–614 - PubMed
    1. Ameye L., Young M. F. (2002) Glycobiology 12, 107R–116R - PubMed
    1. Iozzo R. V. (1999) J. Biol. Chem. 274, 18843–18846 - PubMed

Publication types

MeSH terms