

Heparan sulfate regulates VEGF165- and VEGF121-mediated vascular hyperpermeability
- PMID: 20974861
- PMCID: PMC3013032
- DOI: 10.1074/jbc.M110.177006
Heparan sulfate regulates VEGF165- and VEGF121-mediated vascular hyperpermeability
Abstract
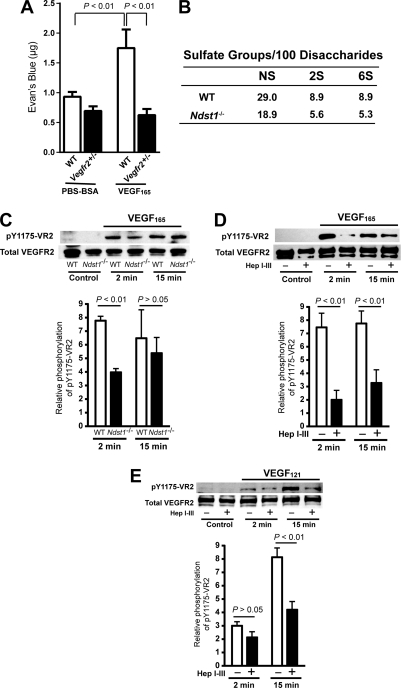
VEGF was first described as vascular permeability factor, a potent inducer of vascular leakage. Genetic evidence indicates that VEGF-stimulated endothelial proliferation in vitro and angiogenesis in vivo depend on heparan sulfate, but a requirement for heparan sulfate in vascular hyperpermeability has not been explored. Here we show that altering endothelial cell heparan sulfate biosynthesis in vivo decreases hyperpermeability induced by both VEGF(165) and VEGF(121). Because VEGF(121) does not bind heparan sulfate, the requirement for heparan sulfate suggested that it interacted with VEGF receptors rather than the ligand. By applying proximity ligation assays to primary brain endothelial cells, we show a direct interaction in situ between heparan sulfate and the VEGF receptor, VEGFR2. Furthermore, the number of heparan sulfate-VEGFR2 complexes increased in response to both VEGF(165) and VEGF(121). Genetic or heparin lyase-mediated alteration of endothelial heparan sulfate attenuated phosphorylation of VEGFR2 in response to VEGF(165) and VEGF(121), suggesting that the functional VEGF receptor complex contains heparan sulfate. Pharmacological blockade of heparan sulfate-protein interactions inhibited hyperpermeability in vivo, suggesting heparan sulfate as a potential target for treating hyperpermeability associated with ischemic disease.
Figures


Similar articles
-
Soluble perlecan domain I enhances vascular endothelial growth factor-165 activity and receptor phosphorylation in human bone marrow endothelial cells.BMC Biochem. 2010 Nov 3;11:43. doi: 10.1186/1471-2091-11-43. BMC Biochem. 2010. PMID: 21047416 Free PMC article.
-
Regulation of pathologic retinal angiogenesis in mice and inhibition of VEGF-VEGFR2 binding by soluble heparan sulfate.PLoS One. 2010 Oct 20;5(10):e13493. doi: 10.1371/journal.pone.0013493. PLoS One. 2010. PMID: 20975989 Free PMC article.
-
Antiangiogenic antithrombin blocks the heparan sulfate-dependent binding of proangiogenic growth factors to their endothelial cell receptors: evidence for differential binding of antiangiogenic and anticoagulant forms of antithrombin to proangiogenic heparan sulfate domains.J Biol Chem. 2006 Dec 8;281(49):37302-10. doi: 10.1074/jbc.M604905200. Epub 2006 Oct 13. J Biol Chem. 2006. PMID: 17040907
-
HSulf-1 inhibits angiogenesis and tumorigenesis in vivo.Cancer Res. 2006 Jun 15;66(12):6025-32. doi: 10.1158/0008-5472.CAN-05-3582. Cancer Res. 2006. PMID: 16778174
-
Signaling from across the way: transactivation of VEGF receptors by HSPGs.Mol Cell. 2006 May 19;22(4):431-2. doi: 10.1016/j.molcel.2006.05.004. Mol Cell. 2006. PMID: 16713570 Review.
Cited by
-
The Role of the Endothelium in HPS Pathogenesis and Potential Therapeutic Approaches.Adv Virol. 2012;2012:467059. doi: 10.1155/2012/467059. Epub 2012 Jun 28. Adv Virol. 2012. PMID: 22811711 Free PMC article.
-
Growth factors with enhanced syndecan binding generate tonic signalling and promote tissue healing.Nat Biomed Eng. 2020 Apr;4(4):463-475. doi: 10.1038/s41551-019-0469-1. Epub 2019 Nov 4. Nat Biomed Eng. 2020. PMID: 31685999
-
Glycosylation in the Tumor Microenvironment: Implications for Tumor Angiogenesis and Metastasis.Cells. 2019 Jun 5;8(6):544. doi: 10.3390/cells8060544. Cells. 2019. PMID: 31195728 Free PMC article. Review.
-
Endorepellin, the angiostatic module of perlecan, interacts with both the α2β1 integrin and vascular endothelial growth factor receptor 2 (VEGFR2): a dual receptor antagonism.J Biol Chem. 2011 Jul 22;286(29):25947-62. doi: 10.1074/jbc.M111.243626. Epub 2011 May 19. J Biol Chem. 2011. PMID: 21596751 Free PMC article.
-
Modulation of Receptor Tyrosine Kinase Activity through Alternative Splicing of Ligands and Receptors in the VEGF-A/VEGFR Axis.Cells. 2019 Mar 28;8(4):288. doi: 10.3390/cells8040288. Cells. 2019. PMID: 30925751 Free PMC article. Review.
References
-
- Mehta D., Malik A. B. (2006) Physiol. Rev. 86, 279–367 - PubMed
-
- Olsson A. K., Dimberg A., Kreuger J., Claesson-Welsh L. (2006) Nat. Rev. Mol. Cell Biol. 7, 359–371 - PubMed
-
- Paul R., Zhang Z. G., Eliceiri B. P., Jiang Q., Boccia A. D., Zhang R. L., Chopp M., Cheresh D. A. (2001) Nat. Med. 7, 222–227 - PubMed
Publication types
MeSH terms
Substances
Grants and funding
LinkOut - more resources
Full Text Sources
Other Literature Sources
Molecular Biology Databases
