. 2010 Nov 9;107(45):19167-70.
doi: 10.1073/pnas.1003669107. Epub 2010 Oct 25.

Driving forces of global wildfires over the past millennium and the forthcoming century

Affiliations

Driving forces of global wildfires over the past millennium and the forthcoming century

O Pechony et al. Proc Natl Acad Sci U S A. .

Abstract

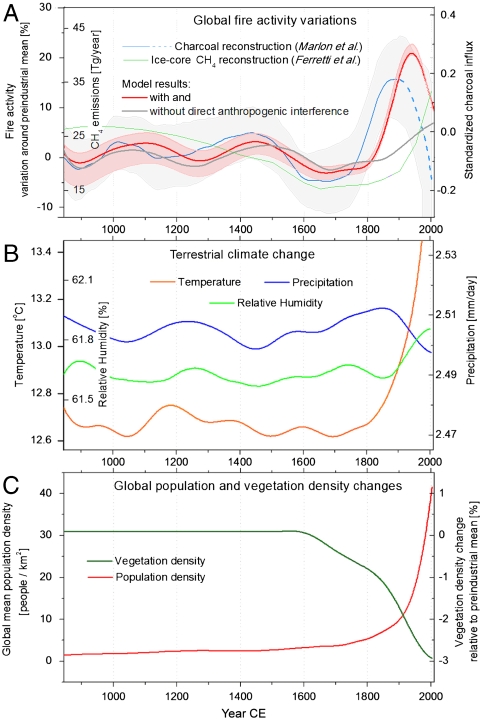
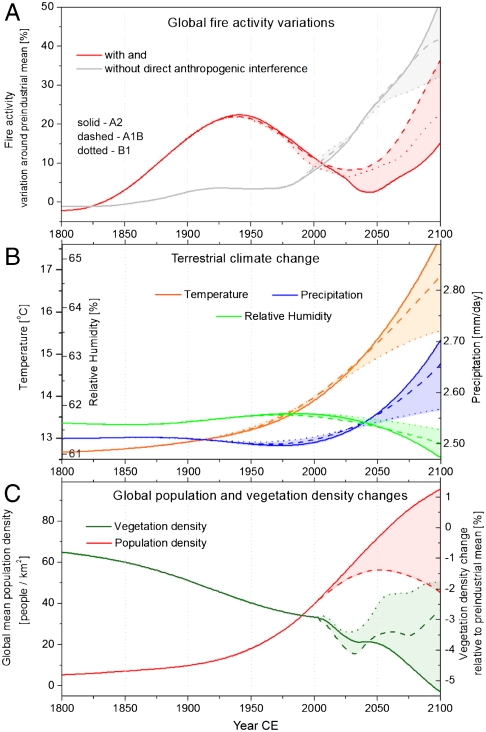
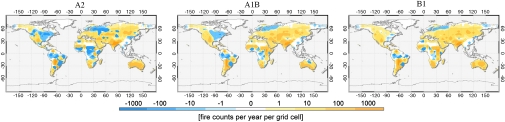
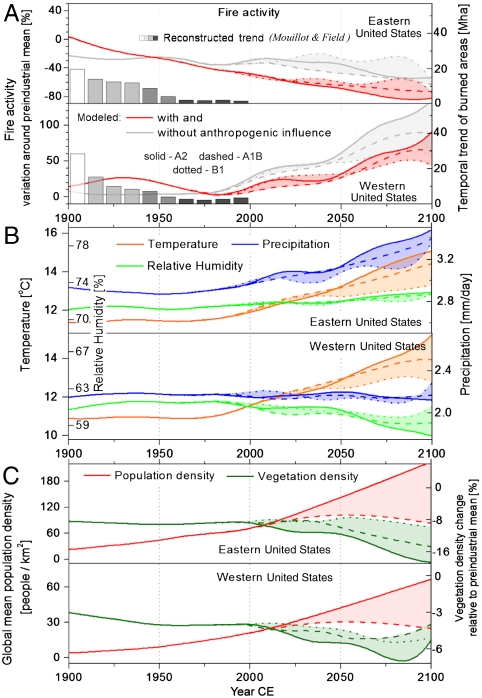
Recent bursts in the incidence of large wildfires worldwide have raised concerns about the influence climate change and humans might have on future fire activity. Comparatively little is known, however, about the relative importance of these factors in shaping global fire history. Here we use fire and climate modeling, combined with land cover and population estimates, to gain a better understanding of the forces driving global fire trends. Our model successfully reproduces global fire activity record over the last millennium and reveals distinct regimes in global fire behavior. We find that during the preindustrial period, the global fire regime was strongly driven by precipitation (rather than temperature), shifting to an anthropogenic-driven regime with the Industrial Revolution. Our future projections indicate an impending shift to a temperature-driven global fire regime in the 21st century, creating an unprecedentedly fire-prone environment. These results suggest a possibility that in the future climate will play a considerably stronger role in driving global fire trends, outweighing direct human influence on fire (both ignition and suppression), a reversal from the situation during the last two centuries.


Conflict of interest statement

The authors declare no conflict of interest.

Figures

Fig. 1.
Fig. 1.
Global fire activity, climate, vegetation, and population. (A) Modeled global fire activity variations (SI Text) with (red line) and without (gray line) direct anthropogenic influence (ignition and suppression): Red-shaded area represents uncertainty in the anthropogenic effect assumptions (SI Text); ice-core methane fire emissions reconstruction (green line) (17) and charcoal-based global fires reconstruction (blue line) with gray-shaded confidence interval (12) and blue dashed line indicating increased uncertainty in the late 20th century reconstructions. (B) GISS GCM annual means of the terrestrial area surface temperature (orange line), precipitation (blue line), and relative humidity (green line). (C) Global mean population (red line) and vegetation (green line) densities (11).
Fig. 2.
Fig. 2.
Projected global fire activity, climate, vegetation, and population. Three SRES scenarios are shown: A2 (“maximum,” continuing past variations with solid line), A1B (“midrange,” dashed line), and B1 (“minimum,” dotted line). (A) Modeled global fire activity with (red lines) and without (gray lines) direct anthropogenic interference; (B) GISS GCM annual means of the terrestrial surface temperature (orange lines), precipitation (blue lines), and relative humidity (green lines). (C) Global mean vegetation (green lines) and population (red lines) densities (A1B and B1 population scenarios coincide) (21).
Fig. 3.
Fig. 3.
Regional patterns of projected fire activity changes. Yellow shades indicate increases, and blue shades indicate decreases in linearized regional fire activity trends over the 21st century (years 2004–2100) in A2, A1B, and B1 scenarios.
Fig. 4.
Fig. 4.
Past and future fire activity, climate, vegetation, and population in the United States. Quantities are the same as in Fig. 2, but each plot shows two regions: the eastern (upper plots) and western (lower plots) United States. Bars show decadal reconstructions of temporal trends of burned areas for the two regions (25), which can be qualitatively compared with fire activity. Bar color indicates reconstruction reliability (25)—“accurate” (black), “good” (gray), “poor” (light gray), and “very poor” (white).

References

    1. Bowman DM, et al. Fire in the Earth system. Science. 2009;324:481–484. - PubMed
    1. Scott AC, Glasspool IJ. The diversification of Paleozoic fire systems and fluctuations in atmospheric oxygen concentration. Proc Natl Acad Sci USA. 2006;103:10861–10865. - PMC - PubMed
    1. Pyne SJ. Fire: A Brief History. Seattle: Univ of Washington Press; 2001.
    1. Westerling AL, Hidalgo HG, Cayan DR, Swetnam TW. Warming and earlier spring increase western U.S. forest wildfire activity. Science. 2006;313:940–943. - PubMed
    1. Lohman DJ, Bickford D, Sodhi NS. Environment: The burning issue. Science. 2007;316:376. - PubMed

Publication types

LinkOut - more resources