

CO2 enhancement of forest productivity constrained by limited nitrogen availability
- PMID: 20974944
- PMCID: PMC2984154
- DOI: 10.1073/pnas.1006463107
CO2 enhancement of forest productivity constrained by limited nitrogen availability
Abstract
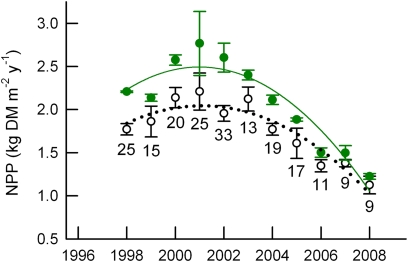
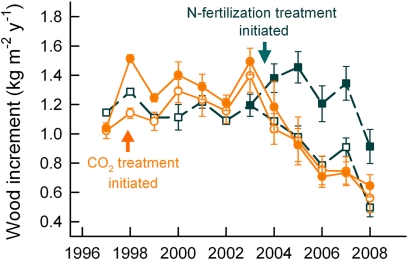
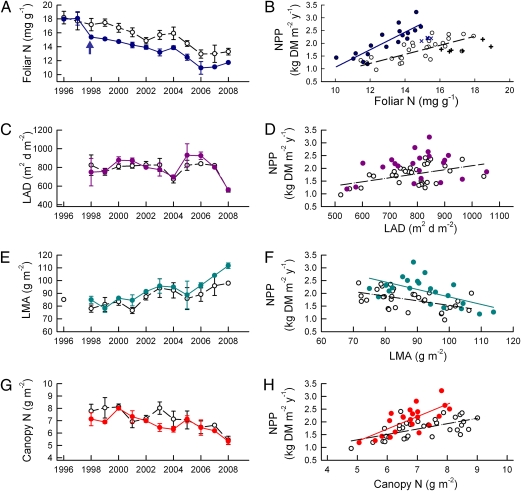
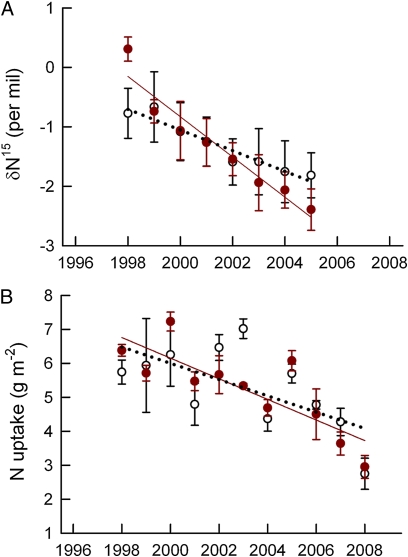
Stimulation of terrestrial plant production by rising CO(2) concentration is projected to reduce the airborne fraction of anthropogenic CO(2) emissions. Coupled climate-carbon cycle models are sensitive to this negative feedback on atmospheric CO(2), but model projections are uncertain because of the expectation that feedbacks through the nitrogen (N) cycle will reduce this so-called CO(2) fertilization effect. We assessed whether N limitation caused a reduced stimulation of net primary productivity (NPP) by elevated atmospheric CO(2) concentration over 11 y in a free-air CO(2) enrichment (FACE) experiment in a deciduous Liquidambar styraciflua (sweetgum) forest stand in Tennessee. During the first 6 y of the experiment, NPP was significantly enhanced in forest plots exposed to 550 ppm CO(2) compared with NPP in plots in current ambient CO(2), and this was a consistent and sustained response. However, the enhancement of NPP under elevated CO(2) declined from 24% in 2001-2003 to 9% in 2008. Global analyses that assume a sustained CO(2) fertilization effect are no longer supported by this FACE experiment. N budget analysis supports the premise that N availability was limiting to tree growth and declining over time--an expected consequence of stand development, which was exacerbated by elevated CO(2). Leaf- and stand-level observations provide mechanistic evidence that declining N availability constrained the tree response to elevated CO(2); these observations are consistent with stand-level model projections. This FACE experiment provides strong rationale and process understanding for incorporating N limitation and N feedback effects in ecosystem and global models used in climate change assessments.
Conflict of interest statement
The authors declare no conflict of interest.
Figures
References
-
- Bonan GB. Forests and climate change: Forcings, feedbacks, and the climate benefits of forests. Science. 2008;320:1444–1449. - PubMed
-
- Denman KL, et al. In: Climate Change 2007: The Physical Science Basis. Contribution of Working Group I to the Fourth Assessment Report of the Intergovernmental Panel on Climate Change. Solomon SD, et al., editors. Cambridge, UK: Cambridge Univ Press; 2007. Chap 7, pp 499–587.
-
- Friedlingstein P, et al. Climate-carbon cycle feedback analysis: Results from the C4MIP model intercomparison. J Clim. 2006;19:3337–3353.
-
- Cramer W, et al. Global response of terrestrial ecosystem structure and function to CO2 and climate change: Results from six dynamic global vegetation models. Glob Change Biol. 2001;7:357–373.
-
- Matthews HD. Implications of CO2 fertilization for future climate change in a coupled climate-carbon model. Glob Change Biol. 2007;13:1068–1078.
Publication types
MeSH terms
Substances
LinkOut - more resources
Full Text Sources
Other Literature Sources
