. 2010 Nov 22;207(12):2631-45.
doi: 10.1084/jem.20092241. Epub 2010 Oct 25.

Proliferating cell nuclear antigen acts as a cytoplasmic platform controlling human neutrophil survival

Affiliations

Proliferating cell nuclear antigen acts as a cytoplasmic platform controlling human neutrophil survival

Véronique Witko-Sarsat et al. J Exp Med. .

Abstract

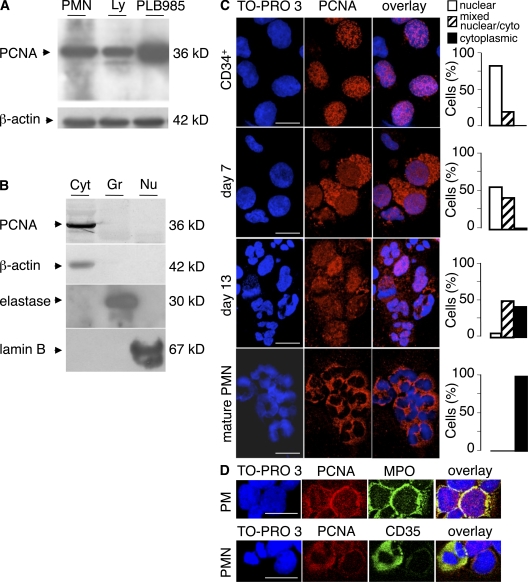
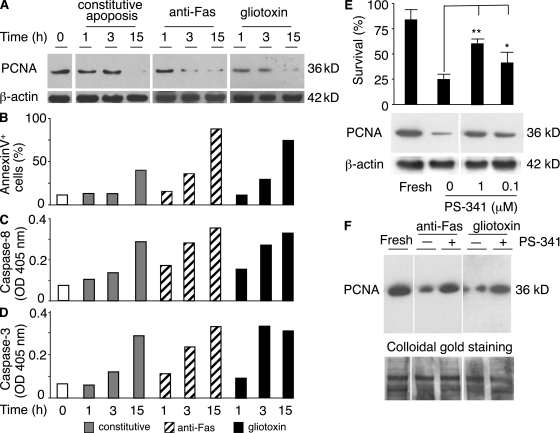
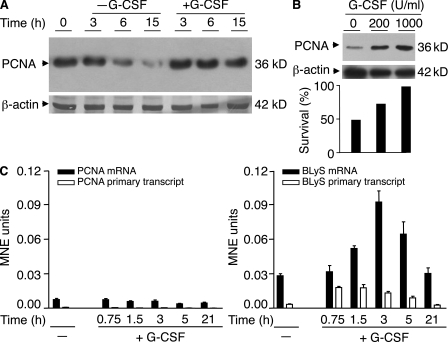
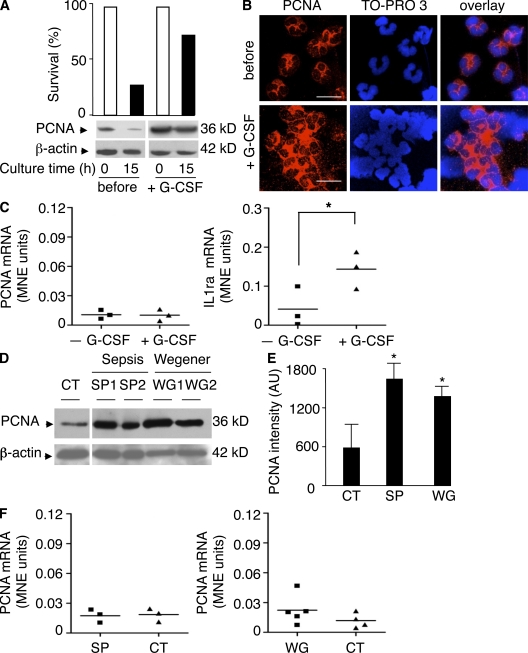
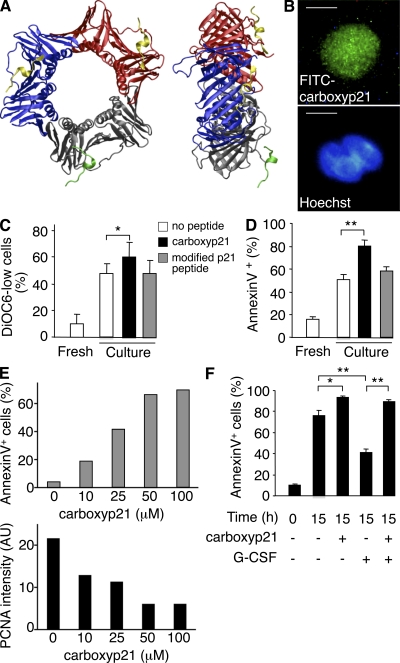
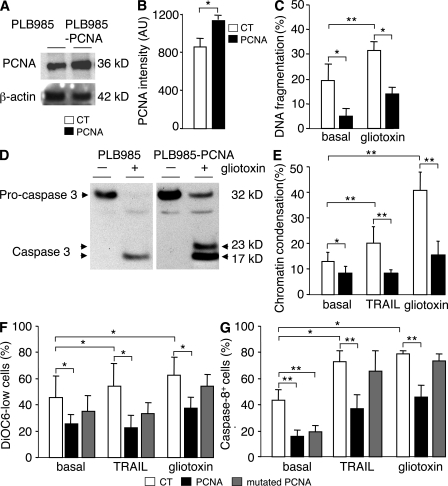
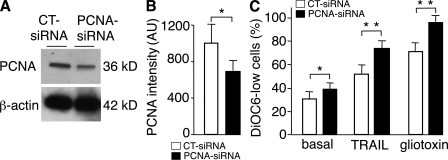
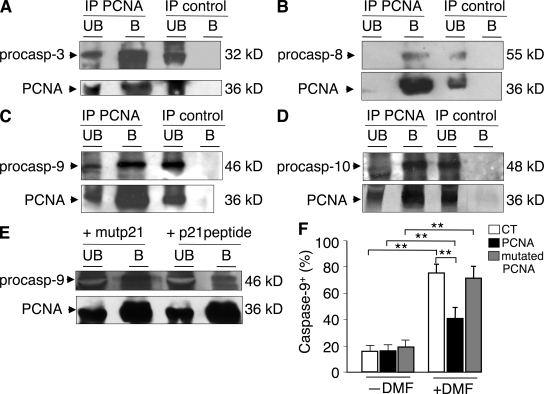
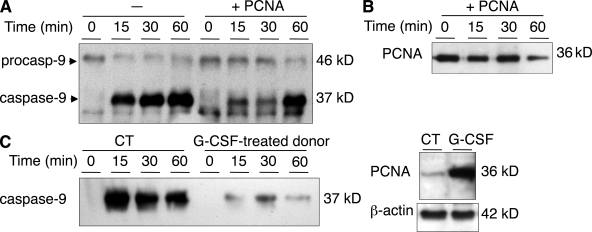
Neutrophil apoptosis is a highly regulated process essential for inflammation resolution, the molecular mechanisms of which are only partially elucidated. In this study, we describe a survival pathway controlled by proliferating cell nuclear antigen (PCNA), a nuclear factor involved in DNA replication and repairing of proliferating cells. We show that mature neutrophils, despite their inability to proliferate, express high levels of PCNA exclusively in their cytosol and constitutively associated with procaspases, presumably to prevent their activation. Notably, cytosolic PCNA abundance decreased during apoptosis, and increased during in vitro and in vivo exposure to the survival factor granulocyte colony-stimulating factor (G-CSF). Peptides derived from the cyclin-dependent kinase inhibitor p21, which compete with procaspases to bind PCNA, triggered neutrophil apoptosis thus demonstrating that specific modification of PCNA protein interactions affects neutrophil survival. Furthermore, PCNA overexpression rendered neutrophil-differentiated PLB985 myeloid cells significantly more resistant to TNF-related apoptosis-inducing ligand- or gliotoxin-induced apoptosis. Conversely, a decrease in PCNA expression after PCNA small interfering RNA transfection sensitized these cells to apoptosis. Finally, a mutation in the PCNA interdomain-connecting loop, the binding site for many partners, significantly decreased the PCNA-mediated antiapoptotic effect. These results identify PCNA as a regulator of neutrophil lifespan, thereby highlighting a novel target to potentially modulate pathological inflammation.


Figures

Figure 1.
Figure 1.
PCNA is expressed exclusively in the cytosol of mature neutrophils. (A) PCNA immunodetection in neutrophils (PMN), lymphocytes (Ly), or PLB985 promyelocytic cells. 50,000 cells/lane were analyzed using PC10 mAb as the primary antibody; anti–β-actin served as the loading control. (B) PCNA expression in different neutrophil subcellular compartments with β-actin, human neutrophil elastase, or lamin B serving as control markers for the cytosolic (Cyt), granular (Gr), and nuclear (Nu) fractions, respectively. The SDS–PAGE gel was run using 50 µg protein/lane, and PCNA was detected with the PC10 mAb. (C) Immunofluorescence analysis by confocal microscopy of PCNA localization in human CD34+ cells before (CD34+) and at different times (7 or 13 d) during granulocyte differentiation and in mature neutrophils using the rabbit pAb Ab5 and TO-PRO 3 iodide for nuclear labeling. Bar graphs show percentages of cells exhibiting nuclear, mixed nuclear–cytoplasmic, or cytoplasmic PCNA localization, as determined by counting the cells under the microscope. (D) Immunofluorescence analysis by confocal microscopy of PCNA localization in human BM cells after sorting on a Percoll gradient. Cells from band 3, containing myeloblasts and promyelocytes (PM; top), were labeled with MPO. In contrast, cells from band 1, containing the mature neutrophils as shown by their typical nuclear morphology (PMN; bottom), were labeled with anti-CD35. A–D show representative experiments of three yielding the same results. Bars, 10 µm.
Figure 2.
Figure 2.
PCNA is degraded by the proteasome during neutrophil apoptosis. (A) PCNA expression kinetics in neutrophils incubated at 37°C for 1, 3, or 15 h alone (constitutive apoptosis), with 10 ng/ml anti-Fas mAb, or with 0.1 µg/ml gliotoxin. Western blot analysis of neutrophil cytosolic fractions (50 µg/lane) using the anti-PCNA PC10 mAb. β-Actin immunoblotting served as a loading control on the same membrane. (B) Flow cytometric measurement of phosphatidylserine externalization on neutrophils cultured as in A and labeled with annexin-V–FITC and 7-AAD to assess apoptosis and necrosis, respectively. (C and D) Spectrophotometric determination of caspase-8 (C) and caspase-3 (D) activities in neutrophil lysates using their respective specific chromogenic IETD-pNA and DEVD-pNA substrates. (E) Effect of the proteasome inhibitor PS-341 at the indicated concentrations on survival (top) and on PCNA expression in neutrophils (bottom) cultured as in A. Apoptosis was obtained by incubating neutrophils at 37°C for 15 h, and neutrophil survival was evaluated as the percentage of annexin-V 7-AAD neutrophils, to exclude cell apoptosis and necrosis, and compared with freshly isolated neutrophils (fresh). Values are means ± SEM of eight independent experiments performed in duplicate (*, P < 0.05; **, P < 0.01; Student’s t test). A representative PCNA immunoblot obtained under the same experimental conditions is shown on the bottom. (F) Effect of 1 µM PS-341 on PCNA expression in neutrophils incubated for 6 h at 37°C with anti-Fas or gliotoxin and compared with freshly isolated neutrophils. The percentages of annexin-V 7-AAD neutrophils used to evaluate neutrophil survival were 60 and 85% in anti-Fas–treated neutrophils (without and with PS-341) and 55 and 80% in the gliotoxin-treated neutrophils (without and with PS-341), compared with 99% in untreated neutrophils. The bottom panel shows colloidal gold staining of the membrane used as a loading control. A–D and F show results from representative experiments that were performed at least four times and yielded identical results.
Figure 3.
Figure 3.
Stable PCNA protein levels are maintained in neutrophils exposed to G-CSF in vitro without transcriptional regulation. (A) Neutrophils were cultured with and without 1,000 U/ml G-CSF at 37°C. After 0, 3, 6, or 15 h of incubation, cells were lysed, and Western blot analysis was performed with the PC10 mAb, and anti–β-actin served as the loading control. (B) Neutrophils were incubated for 15 h at 37°C in the absence (0) or in the presence of 200 or 1,000 U/ml G-CSF and analyzed as described in A. The percentages of viable neutrophils, i.e., annexin-V 7-AAD cells under the same conditions, are shown in the histogram below the blot. (C) Total RNA was extracted from neutrophils cultured with and without 1,000 U/ml G-CSF for the times indicated, and PCNA, BLyS, and β2m mRNA expression was measured by real-time RT-PCR and primary transcript real-time RT-PCR. Their expression is given as mean normalized expression (MNE) after normalization to β2m in triplicate reactions for each sample. Error bars represent SEM. The data presented in A–C are from one representative experiment of three.
Figure 4.
Figure 4.
High PCNA protein levels in neutrophils isolated from G-CSF–treated donors and from patients with systemic inflammation. (A) Neutrophils from a representative G-CSF–treated donor were analyzed either before or during (+G-CSF) cytokine exposure, with PCNA immunodetected in lysates from either freshly isolated (0) or 15-h cultured cells. The percentages of viable neutrophils after culture as in Fig. 3 B are shown in the histogram above the blot. (B) Immunofluorescence analysis by confocal microscopy of neutrophil PCNA detected with the Ab5 pAb. Neutrophils were isolated from a donor before or during (+G-CSF) in vivo G-CSF treatment. Data in A and B are from one G-CSF–treated donor, representative of four different donors. Bars, 10 µm. (C) Total RNA was extracted from neutrophils isolated from healthy donors or G-CSF–treated patients and assayed in triplicates. PCNA and IL-1ra mRNA was normalized to β2m expression and expressed as mean normalized expression (MNE) units. mRNA analysis was performed in three donors before and during G-CSF treatment (*, P < 0.05). (D) Representative Western blots showing neutrophil lysates prepared just after cell isolation from a control subject (CT) or from two patients with sepsis (SP1 and SP2) or Wegener’s granulomatosis (WG1 and WG2). (E) Densitometric analysis of PCNA expression in healthy subjects (CT; n = 7), patients with sepsis (SP; n = 5), and patients with Wegener’s granulomatosis (WG; n = 8). Data are expressed as arbitrary units (AU; means ± SEM; *, P < 0.05; Student’s t test). (F) Analysis of PCNA mRNA expression in neutrophils isolated from sepsis (n = 3) and Wegener’s granulomatosis (n = 5) patients or healthy donors (CT; n = 7). (C and F) Horizontal bars represent the mean value.
Figure 5.
Figure 5.
Potentiation of neutrophil apoptosis by carboxyp21, a PCNA-competing peptide. The synthetic carboxyp21 and a control modified p21 peptide (whose charged amino acids, identified as crucial for binding to PCNA, were modified to prevent its binding to PCNA) were incubated with neutrophils to evaluate their effect on apoptosis. (A) Structure of PCNA (blue, red, and gray are used to distinguish the three monomers) bound to two carboxyp21 (yellow) and one modified p21 peptide (green). The structure represented was obtained at the end of the MD simulation. The secondary structure elements are highlighted by a ribbon representation, and two different views are presented: from above the ring (left) and from the side (right). (B) Neutrophils were incubated with 50 µM FITC-conjugated carboxyp21 peptide for 1 h and then analyzed by fluorescence microscopy. The nucleus was visualized by Hoechst staining. The panels show one representative experiment of four. Bars, 5 µm. (C and D) Neutrophils were cultured for 6 h at 37°C alone or with 50 µM carboxyp21 or modified carboxyp21. The percentages of apoptotic neutrophils were assessed as depolarized mitochondria after DiOC6 labeling (C) or phosphatidylserine externalization after annexin-V labeling (D). Basal apoptosis was assessed before incubation (fresh). Data are means ± SEM of five independent experiments (*, P < 0.05; **, P < 0.01; Student’s t test). (E) Neutrophils were exposed to increasing carboxyp21 concentrations for 3 h, and apoptosis was measured by annexin-V labeling. The PCNA expression in the same samples was evaluated by Western blot analysis, and the bands were quantified by densitometric scanning. Data are from one representative experiment of four. AU, arbitrary unit. (F) Neutrophils were incubated with or without 1,000 U/ml G-CSF in the presence or absence of 50 µM carboxyp21 for 15 h before determining the percentage of apoptotic cells by annexin-V labeling. Data are means ± SEM of five independent experiments (*, P < 0.05; **, P < 0.01; Student’s t test).
Figure 6.
Figure 6.
Stable PCNA transfection protects neutrophil-differentiated PLB985 myeloid cells from apoptosis. (A) Cytosolic PCNA expression in control (CT; pcDNA3-transfected cells) and pcDNA3PCNA-transfected PLB985 cells, as detected by Western blot analysis using the Ab5 pAbs and β-actin as loading control. (B) Quantification of PCNA expression after densitometry scanning and analysis by ImageJ software. Data are means ± SEM of six independent experiments (*, P < 0.05; Student’s t test). AU, arbitrary unit. (C–G) DMF-differentiated control or PCNA- or mutated PCNA–transfected PLB985 cells were incubated with or without 2 µg/ml gliotoxin or 10 ng/ml TRAIL for 15 h to induce apoptosis. (C) Percentage of cells in the sub-G1 phase showing DNA fragmentation after propidium iodide labeling. (D) Caspase-3 expression by Western blot analysis in DMF-differentiated PLB985 cells after gliotoxin-induced apoptosis. Data are from one representative experiment that was performed four times, yielding identical results. (E) Percentage of cells showing chromatin condensation after Hoechst labeling. (F) Percentage of cells with mitochondrial depolarization after DiOC6 labeling. (G) Percentage of cells with caspase-8 activation using a fluorescent IETD-based substrate. Data from C and E–G are means ± SEM of at least four independent experiments (*, P < 0.05; **, P < 0.01; Student’s t test).
Figure 7.
Figure 7.
Knocking down PCNA expression by siRNA sensitizes DMF-differentiated PLB985 cells to apoptosis. DMF-differentiated PLB985 cells were transfected twice with control (CT) siRNA or with PCNA siRNA on days 3 and 4 after DMF. (A) Cytosolic PCNA expression was evaluated by Western blot analysis using the Ab5 pAb (β-actin expression was used as loading control). (B) Quantification of PCNA expression by densitometric scanning using ImageJ software. Data are means ± SEM of six independent experiments (*, P < 0.05; Student’s t test). (C) Effect of PCNA siRNA on the percentage of apoptotic PLB985 cells as measured by mitochondrial depolarization after DiOC6 labeling. PLB985 cells were incubated with 2 µg/ml gliotoxin (n = 6), 10 ng/ml TRAIL (n = 5), or in basal conditions (n = 10) for 15 h. Data are means ± SEM of n independent experiments (*, P < 0.05; **, P < 0.01; Student’s t test).
Figure 8.
Figure 8.
Co-IP experiments identify procaspase-3, procaspase-8, procaspase-9, and procaspase-10 as PCNA partners. Co-IP experiments were performed using neutrophil cytosol. Unbound material (UB) and bound (B) immunoprecipitated proteins were analyzed by Western blot analysis. (A–D) In IP, PCNA pAb (IP PCNA) or empty beads (IP control) were used, whereas in Western blot analysis, PC10 anti-PCNA was used (to ascertain the presence of PCNA) together with one of the following: anti–procaspase-3 mAb (A), anti–procaspase-8 mAb (B), anti–procaspase-9 mAb (C), or anti–procaspase-10 mAb (D). (E) Co-IP experiments performed as in C using PCNA containing neutrophil cytosol incubated with 100 µM carboxyp21 or the mutated p21 peptide (used as a control). Both unbound material and bound immunoprecipitated proteins were analyzed by Western blot analysis using anti–procaspase-9 and anti-PCNA (PC10). A–E show data from representative experiments that were performed at least four times, yielding identical results. (F) Caspase-9 activity in PLB985 cells overexpressing wild-type or mutated PCNA compared with controls (CT). CD11b+–caspase-9+ cells were measured by flow cytometry before and after DMF-induced differentiation. Data are means ± SEM of four independent experiments (**, P < 0.01; Student’s t test).
Figure 9.
Figure 9.
PCNA impaired pro–caspase-9 activation in vitro. (A) Kinetics of immunodetection of cleaved caspase-9 after an in vitro procaspase-9 activation assay performed using neutrophil cytosol, 50 µM cytochrome c, and 1 mM ATP, without and with 50 µM recombinant PCNA. (B) Kinetics of PCNA immunodetection using PCNA pAb performed in the same in vitro assay as in A in the absence of exogenous recombinant PCNA to detect only endogenous PCNA. (C) Kinetics of cleaved caspase-9 immunodetection as in A in cytosol of neutrophils isolated from G-CSF–treated donors or controls (CT). PCNA Western blot analysis confirmed higher PCNA levels in the G-CSF–treated donors (right). A–C show data from representative experiments that were performed at least four times, yielding identical results.

References

    1. Altznauer F., Martinelli S., Yousefi S., Thürig C., Schmid I., Conway E.M., Schöni M.H., Vogt P., Mueller C., Fey M.F., et al. 2004. Inflammation-associated cell cycle–independent block of apoptosis by survivin in terminally differentiated neutrophils. J. Exp. Med. 199:1343–1354 10.1084/jem.20032033 - DOI - PMC - PubMed
    1. Basu S., Hodgson G., Katz M., Dunn A.R. 2002. Evaluation of role of G-CSF in the production, survival, and release of neutrophils from bone marrow into circulation. Blood. 100:854–861 10.1182/blood.V100.3.854 - DOI - PubMed
    1. Borregaard N., Heiple J.M., Simons E.R., Clark R.A. 1983. Subcellular localization of the b-cytochrome component of the human neutrophil microbicidal oxidase: translocation during activation. J. Cell Biol. 97:52–61 10.1083/jcb.97.1.52 - DOI - PMC - PubMed
    1. Cassatella M.A. 1999. Neutrophil-derived proteins: selling cytokines by the pound. Adv. Immunol. 73:369–509 10.1016/S0065-2776(08)60791-9 - DOI - PubMed
    1. Cowland J.B., Borregaard N. 1999. Isolation of neutrophil precursors from bone marrow for biochemical and transcriptional analysis. J. Immunol. Methods. 232:191–200 10.1016/S0022-1759(99)00176-3 - DOI - PubMed

Publication types

MeSH terms