

Haptoglobin as an early serum biomarker of virus-induced autoimmune type 1 diabetes in biobreeding diabetes resistant and LEW1.WR1 rats
- PMID: 20975081
- PMCID: PMC4172443
- DOI: 10.1258/ebm.2010.010150
Haptoglobin as an early serum biomarker of virus-induced autoimmune type 1 diabetes in biobreeding diabetes resistant and LEW1.WR1 rats
Abstract
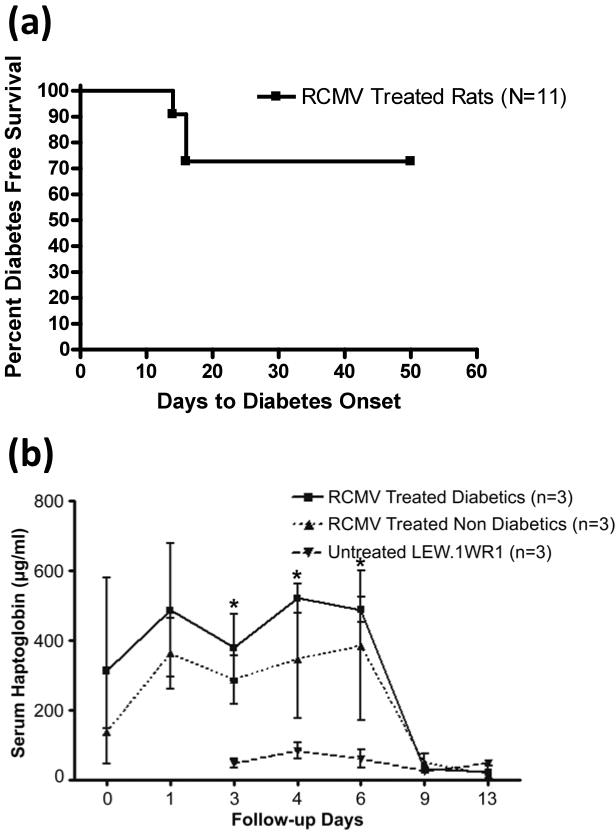
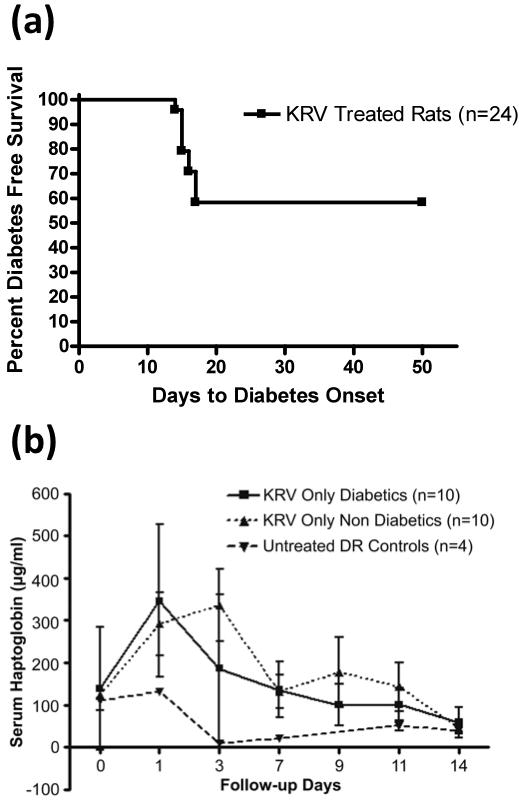
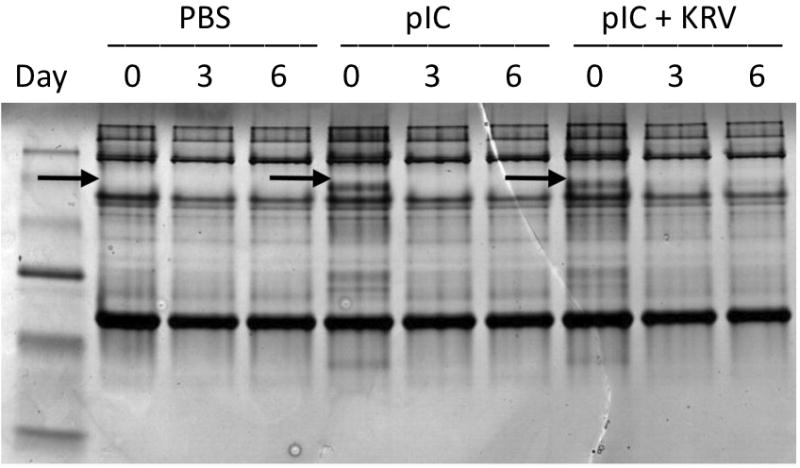
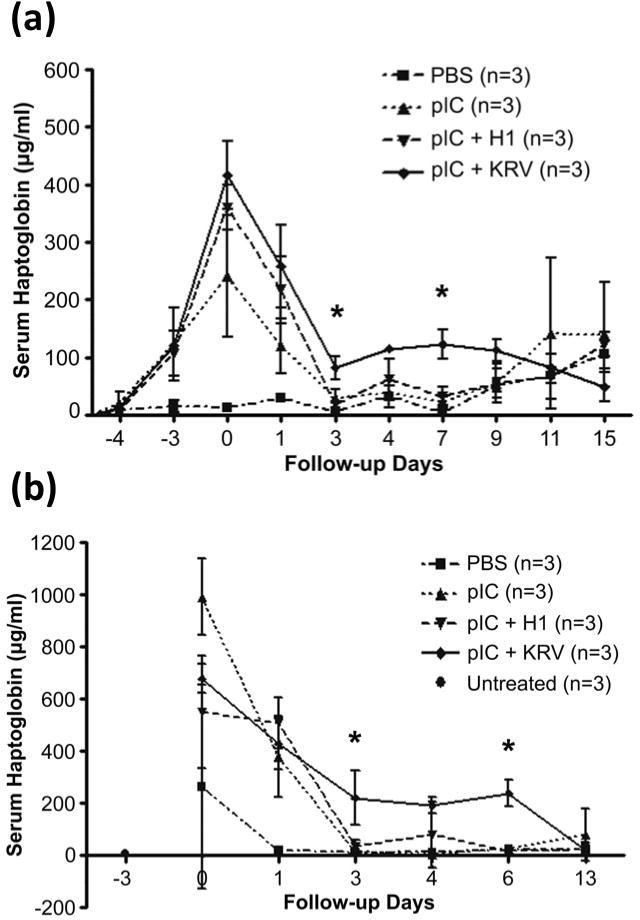
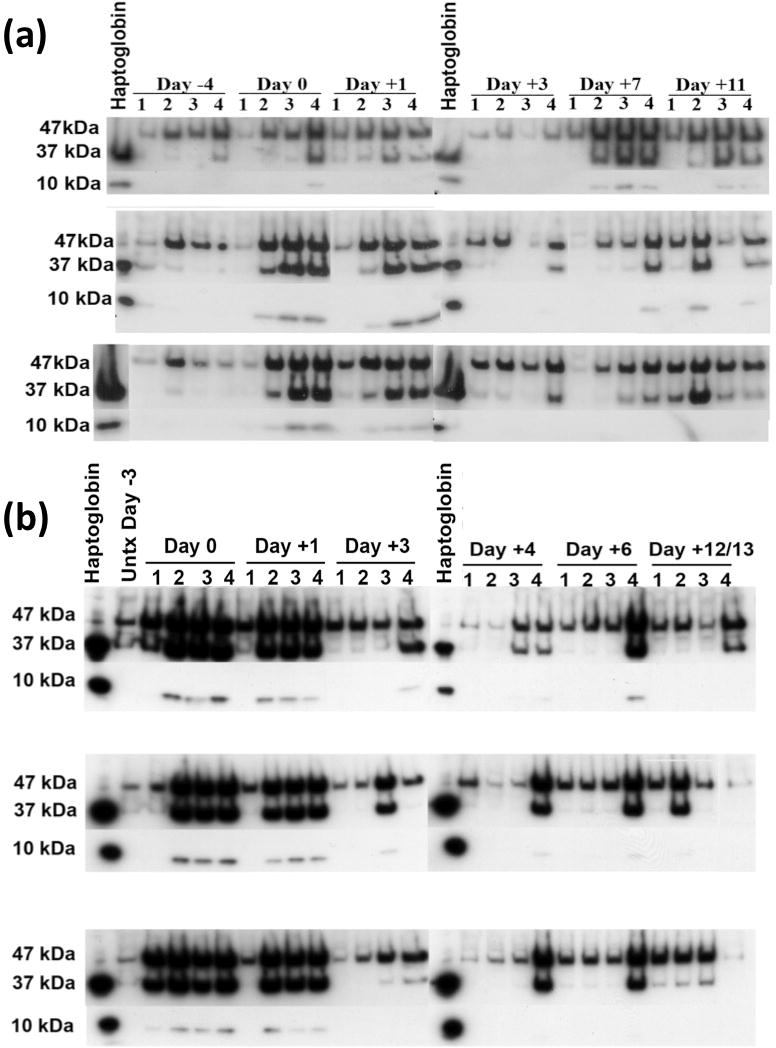
Proteomic profiling of serum is a powerful technique to identify differentially expressed proteins that can serve as biomarkers predictive of disease onset. In this study, we utilized two-dimensional (2D) gel analysis followed by matrix-assisted-laser desorption/ionization time-of-flight mass spectrometry analysis to identify putative serum biomarkers for autoimmune type 1 diabetes (T1D) in biobreeding diabetes resistant (BBDR) rats induced to express the disease. Treatment with toll-like receptor 3 ligand, polyinosinic:polycytidilic acid (pIC), plus infection with Kilham rat virus (KRV), a rat parvovirus, results in nearly 100% of young BBDR rats becoming diabetic within 11-21 d. Sera collected from prediabetic rats at early time points following treatment with pIC + KRV were analyzed by 2D gel electrophoresis and compared with sera from control rats treated with phosphate-buffered saline, pIC alone or pIC + H1, a non-diabetogenic parvovirus. None of the latter three control treatments precipitates T1D. 2D gel analysis revealed that haptoglobin, an acute phase and hemoglobin scavenger protein, was differentially expressed in the sera of rats treated with pIC + KRV relative to control groups. These results were confirmed by Western blot and enzyme-linked immunosorbent assay studies, which further validated haptoglobin levels as being differentially increased in the sera of pIC + KRV-treated rats relative to controls during the first week following infection. Early elevations in serum haptoglobin were also observed in LEW1.WR1 rats that became diabetic following infection with rat cytomegalovirus. The identification and validation of haptoglobin as a putative serum biomarker for autoimmune T1D in rats now affords us the opportunity to test the validity of this protein as a biomarker for human T1D, particularly in those situations where viral infection is believed to precede the onset of disease.
Conflict of interest statement
The authors have no conflict of interest to report.
Figures
Similar articles
-
Rat Models of Virus-Induced Type 1 Diabetes.Methods Mol Biol. 2020;2128:107-114. doi: 10.1007/978-1-0716-0385-7_8. Methods Mol Biol. 2020. PMID: 32180189
-
Kilham rat triggers T-cell-dependent autoimmune diabetes in multiple strains of rat.Diabetes. 1996 May;45(5):557-62. doi: 10.2337/diab.45.5.557. Diabetes. 1996. PMID: 8621003
-
Salicylate prevents virus-induced type 1 diabetes in the BBDR rat.PLoS One. 2013 Oct 16;8(10):e78050. doi: 10.1371/journal.pone.0078050. eCollection 2013. PLoS One. 2013. PMID: 24147110 Free PMC article.
-
Visceral Adipose Tissue: A New Target Organ in Virus-Induced Type 1 Diabetes.Front Immunol. 2021 Aug 4;12:702506. doi: 10.3389/fimmu.2021.702506. eCollection 2021. Front Immunol. 2021. PMID: 34421908 Free PMC article. Review.
-
Viruses cause type 1 diabetes in animals.Ann N Y Acad Sci. 2006 Oct;1079:138-46. doi: 10.1196/annals.1375.021. Ann N Y Acad Sci. 2006. PMID: 17130545 Review.
Cited by
-
High abundant protein removal from rodent blood for biomarker discovery.Biochem Biophys Res Commun. 2014 Dec 5;455(1-2):84-9. doi: 10.1016/j.bbrc.2014.09.137. Biochem Biophys Res Commun. 2014. PMID: 25445603 Free PMC article.
-
Acute phase proteins in animals.Prog Mol Biol Transl Sci. 2012;105:113-50. doi: 10.1016/B978-0-12-394596-9.00005-6. Prog Mol Biol Transl Sci. 2012. PMID: 22137431 Free PMC article. Review.
-
High-Resolution Native Mass Spectrometry.Chem Rev. 2022 Apr 27;122(8):7269-7326. doi: 10.1021/acs.chemrev.1c00212. Epub 2021 Aug 20. Chem Rev. 2022. PMID: 34415162 Free PMC article. Review.
-
N-glycoproteomic analysis of human follicular fluid during natural and stimulated cycles in patients undergoing in vitro fertilization.Clin Exp Reprod Med. 2017 Jun;44(2):63-72. doi: 10.5653/cerm.2017.44.2.63. Epub 2017 Jun 30. Clin Exp Reprod Med. 2017. PMID: 28795044 Free PMC article.
-
Searching for Novel Candidate Biomarkers of RLS in Blood by Proteomic Analysis.Nat Sci Sleep. 2021 Jun 25;13:873-883. doi: 10.2147/NSS.S311801. eCollection 2021. Nat Sci Sleep. 2021. PMID: 34234594 Free PMC article.
References
-
- She JX. Susceptibility to type I diabetes: HLA-DQ and DR revisited. Immunol Today. 1996;17:323–329. - PubMed
-
- Field LL. Genetic linkage and association studies of Type I diabetes: challenges and rewards. Diabetologia. 2002;45:21–35. - PubMed
-
- Rossini AA, Handler ES, Mordes JP, Greiner DL. Human autoimmune diabetes mellitus: lessons from BB rats and NOD mice–Caveat emptor. Clin Immunol Immunopathol. 1995;74:2–9. - PubMed
-
- Jun HS, Yoon JW. The role of viruses in type I diabetes: two distinct cellular and molecular pathogenic mechanisms of virus-induced diabetes in animals. Diabetologia. 2001;44:271–285. - PubMed
Publication types
MeSH terms
Substances
Grants and funding
LinkOut - more resources
Full Text Sources
Medical