. 2010 Apr 12:1:3.
doi: 10.1038/ncomms1001.

Sirt1 improves healthy ageing and protects from metabolic syndrome-associated cancer

Affiliations

Sirt1 improves healthy ageing and protects from metabolic syndrome-associated cancer

Daniel Herranz et al. Nat Commun. .

Abstract

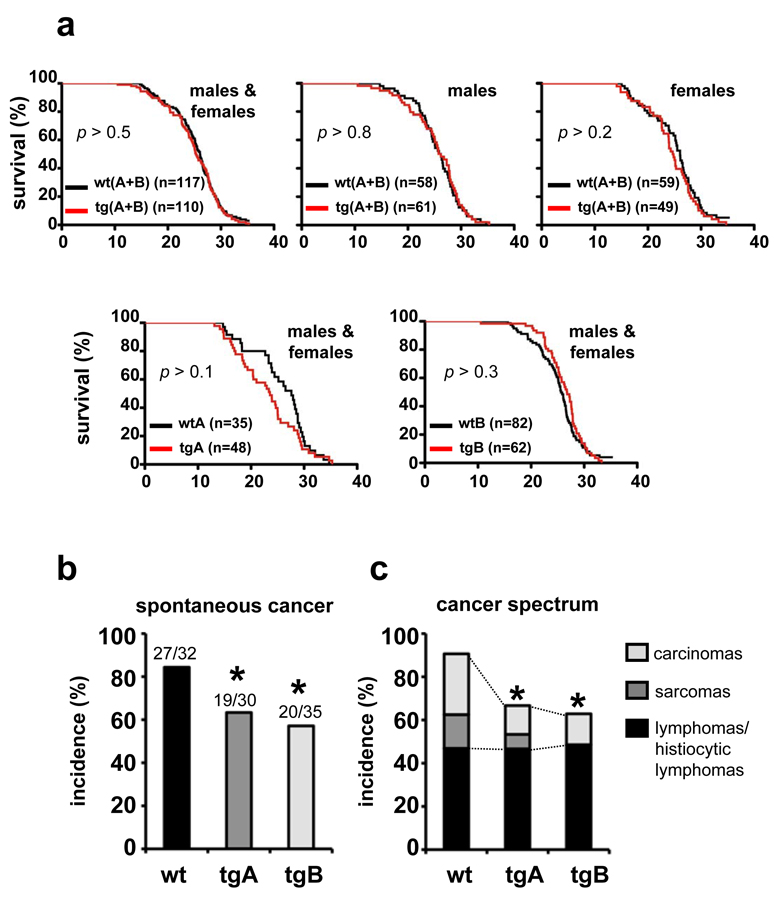
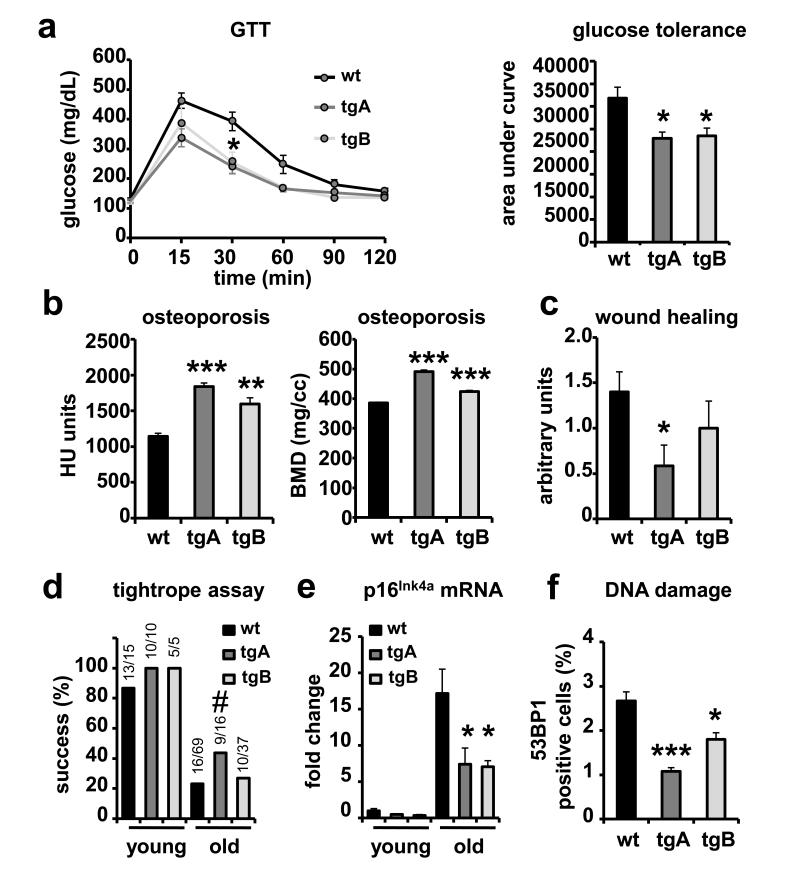
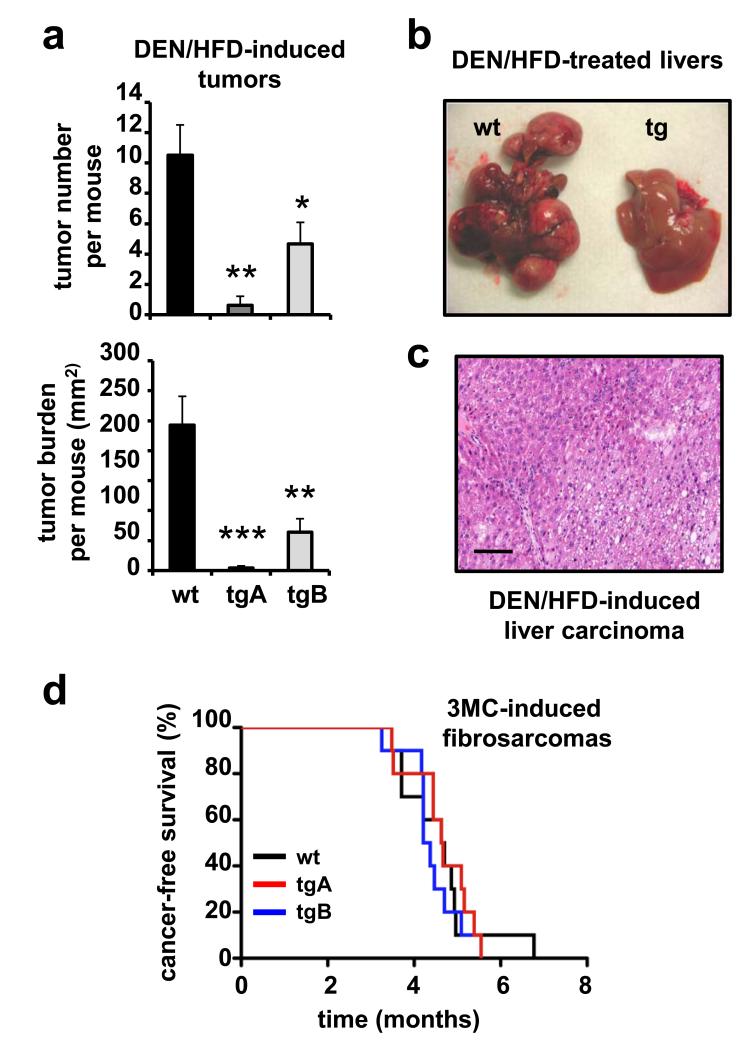
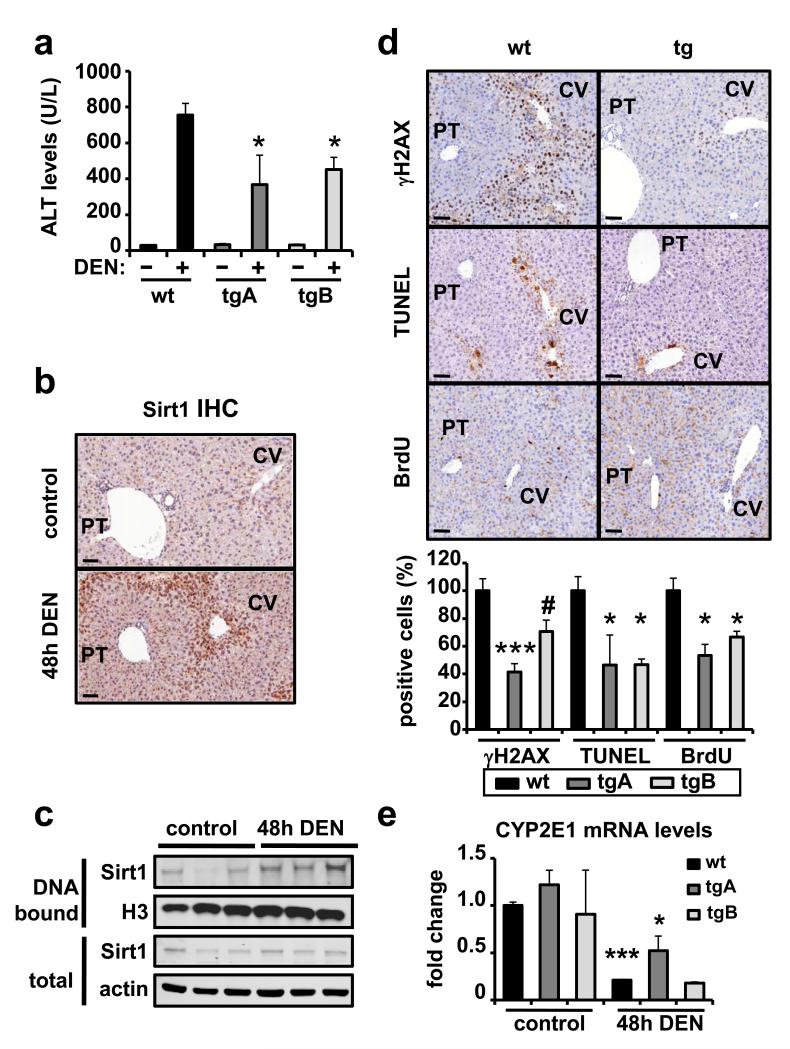
Genetic overexpression of protein deacetylase Sir2 increases longevity in a variety of lower organisms, and this has prompted interest in the effects of its closest mammalian homologue, Sirt1, on ageing and cancer. We have generated transgenic mice moderately overexpressing Sirt1 under its own regulatory elements (Sirt1-tg). Old Sirt1-tg mice present lower levels of DNA damage, decreased expression of the ageing-associated gene p16(Ink4a), a better general health and fewer spontaneous carcinomas and sarcomas. These effects, however, were not sufficiently potent to affect longevity. To further extend these observations, we developed a metabolic syndrome-associated liver cancer model in which wild-type mice develop multiple carcinomas. Sirt1-tg mice show a reduced susceptibility to liver cancer and exhibit improved hepatic protection from both DNA damage and metabolic damage. Together, these results provide direct proof of the anti-ageing activity of Sirt1 in mammals and of its tumour suppression activity in ageing- and metabolic syndrome-associated cancer.


Figures

Figure 1
Figure 1. Normal lifespan but enhanced cancer protection in Sirt1-tg mice
(a) Survival of cohorts of mice of the indicated genotypes. Logrank tests indicated that Sirt1-tg mice were not statistically different from wt mice (p > 0.05). (b) Spontaneous cancer incidence. Statistical significance vs wt mice was calculated using the Fisher’s Exact test : *p < 0.05. (c) Cancer spectrum. Statistical analysis refers to the combined incidence of carcinomas and sarcomas vs wt mice using the Fisher’s Exact test : *p < 0.05.
Figure 2
Figure 2. Improved healthy aging in Sirt1-tg mice
(a) Glucose tolerance test in 1.5 years old male mice (n ≥ 4 per group). Curves are shown to the left. Integrated AUCs (area under curve) are shown to the right. (b) Osteoporosis was analyzed in 2.5 years old male mice (n = 3 per group) by microcomputed tomography (microCT). Values of Hounsfield units (HU) and bone mineral density (BMD) for the entire femurs are shown. (c) Wound-healing assay in ≥ 2 years old mice (n ≥ 10 per group). (d) Neuromuscular coordination assay. Young (< 6 months) and old (> 2 years) mice were subjected to the tightrope assay. (e) Levels of p16Ink4a mRNA in livers of young (< 6 months) and old (≥ 2 years) mice (n ≥ 3 per group) were analyzed by qRT-PCR. Data are relative to the levels in young wt mice. (f) Levels of DNA damage in the liver of old (≥ 2 years) mice (n ≥ 3 per genotype) measured as the percentage of 53BP1-foci positive nuclei by confocal microscopy. In all graphs except panel (d), values are given as average ± SEM, and statistical analyses are relative to wt controls and determined by the two-tailed Student’s t-test: *p < 0.05; **p < 0.01; ***p < 0.005. For panel (d), statistical significance was calculated using the Fisher’s Exact test: #p < 0.1.
Figure 3
Figure 3. Sirt1 protects from metabolic syndrome-associated liver cancer
(a) Tumor number and tumor burden in mice injected with diethylnitrosamine (DEN) and maintained for 11 months under high-fat diet (HFD). Tumors were measured by microCT. Tumor burden per mouse was obtained by adding the areas of the biggest section of each tumor. All the assays were performed with male mice (n ≥ 5 per group). Values are given as average ± SEM, statistical analyses are relative to wt controls and determined by the two-tailed Student’s t-test: *p < 0.05; **p < 0.01; ***p < 0.005. (b) Macroscopic view of representative livers from littermate mice of the indicated genotypes 11 months after initiation of the DEN/HFD protocol. (c) Histology of a representative liver carcinoma induced by the DEN/HFD protocol. Hematoxylin and eosin staining. The bar indicates 100 μm. (d) Susceptibility to 3MC-induced fibrosarcomas. Mice of the indicated genotypes were injected intramuscularly with 3-methyl-cholanthrene (3MC) in one of the rear legs and the latency for the development of fibrosarcomas was scored. Logrank test indicated no significant differences (p > 0.6) between genotypes.
Figure 4
Figure 4. Sirt1 protects from DNA damage in the liver
(a) Alanine transaminase (ALT) levels in serum before or 48 hours after DEN injection (n ≥ 3 per group). (b) Liver sections stained for Sirt1 before or 48 hours after DEN injection in wt mice. The bar indicates 50 μm. (c) Liver protein levels of Sirt1 bound to chromatin or in total extracts from wt mice (n=3) before or 48 hours after DEN injection. Histone H3 and actin were used as loading controls. (d) Representative stainings of DNA damage (γH2AX), apoptosis (TUNEL), and compensatory proliferation (BrdU), each showing a centrolobular area (around a centrolobular vein marked as CV) and a portal area (around a portal triad marked as PT) of livers of mice 48 hours after DEN injection. Bars indicate 50 μm. Quantifications are shown below relative to wt DEN-treated livers. For quantifications, at least 5 microscope fields at 20× magnification, always containing a CV and a PT were scored (n ≥ 3 per genotype). (e) Levels of CYP2E1 in the livers of control or DEN-treated mice (n ≥ 3 per group). Differences between tg samples and wt control were not significant (p > 0.1) in all cases. In all graphs, values are given as average ± SEM, statistical analyses are relative to wt controls and determined by the two-tailed Student’s t-test: #p < 0.1; *p < 0.05; ***p < 0.005.

References

    1. Bishop NA, Guarente L. Genetic links between diet and lifespan: shared mechanisms from yeast to humans. Nat Rev Genet. 2007;8:835–844. - PubMed
    1. Michan S, Sinclair D. Sirtuins in mammals: insights into their biological function. Biochem J. 2007;404:1–13. - PMC - PubMed
    1. Garber K. A mid-life crisis for aging theory. Nat Biotechnol. 2008;26:371–374. - PubMed
    1. Deng CX. SIRT1, is it a tumor promoter or tumor suppressor? Int J Biol Sci. 2009;5:147–152. - PMC - PubMed
    1. Wang RH, et al. Impaired DNA damage response, genome instability, and tumorigenesis in SIRT1 mutant mice. Cancer Cell. 2008;14:312–323. - PMC - PubMed

Publication types

MeSH terms