

Protein expression profiling in the spectrum of renal cell carcinomas
- PMID: 20975849
- PMCID: PMC2962428
- DOI: 10.7150/jca.1.184
Protein expression profiling in the spectrum of renal cell carcinomas
Abstract
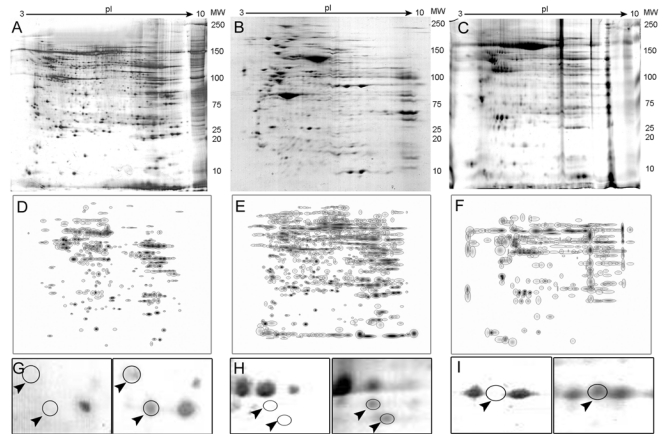
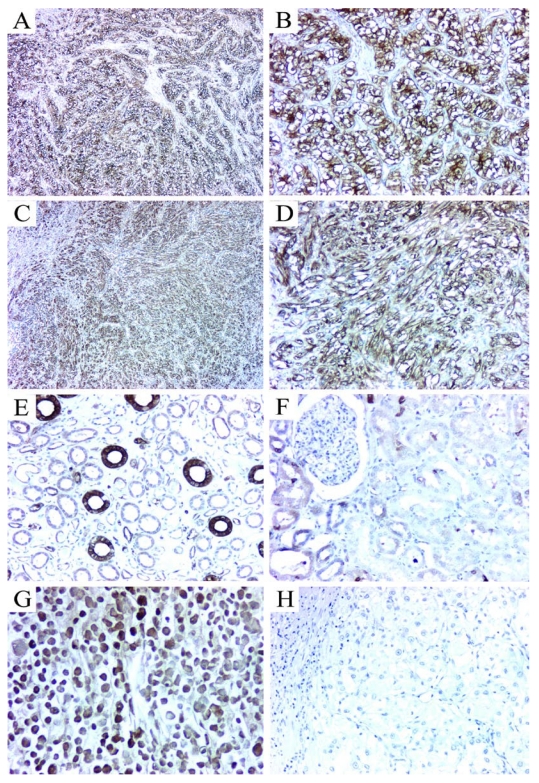
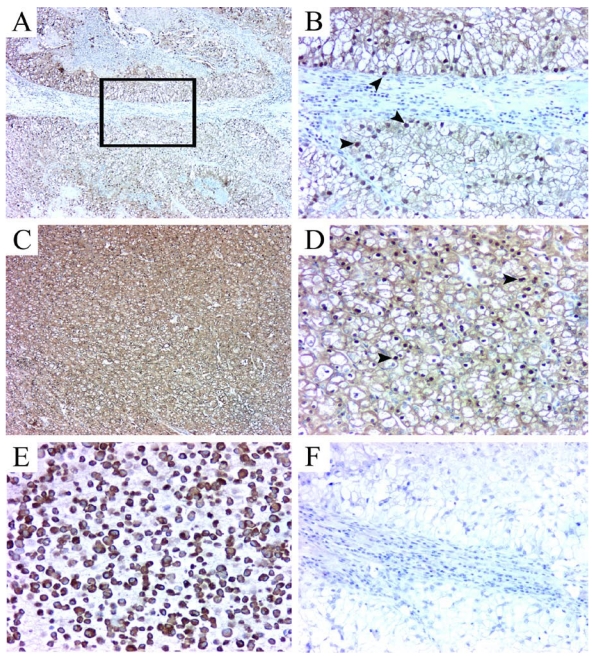
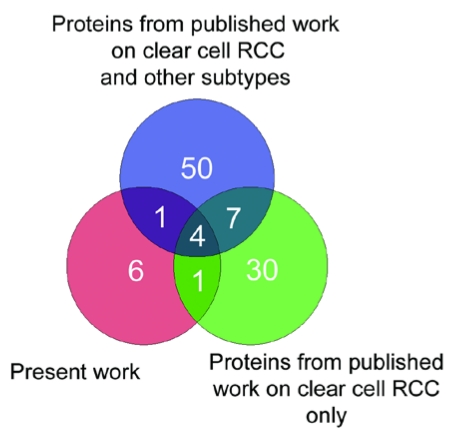
In this study, we aimed to evaluate the protein expression profile of a spectrum of renal cell carcinomas (RCC) to find potential biomarkers for disease onset and progression and therefore, prospective therapeutic targets. A 2D-gel based proteomic analysis was used to outline differences in protein levels among different subtypes of renal cell carcinomas, including clear cell carcinomas, papillary lesions, chromophobe tumors and renal oncocytomas. Spot pattern was compared to the corresponding normal kidney from the same patients and distinctive, differentially expressed proteins were characterized by mass spectrometry. Twenty-one protein spots were found differentially expressed between clear cell RCC and normal tissue and 38 spots were found expressed in chromophobe tumors. Eleven proteins were identified, with most differentially expressed -by fold change- between clear cell tumors and the corresponding normal tissue. Two of the identified proteins, Triosephosphate isomerase 1 (TPI-1) and Heat Shock protein 27 (Hsp27), were further validated in a separate set of tumors by immunohistochemistry and expression levels were correlated with clinicopathologic features of the patients. Hsp27 was highly expressed in 82% of the tumors used for validation, and all cases showed strong immunoreactivity for TPI-1. In both Hsp27 and TPI-1, protein expression positively correlated with histologic features of the disease. Our results suggest that the subjacent cytogenetic abnormalities seen in different histological types of RCC are followed by specific changes in protein expression. From these changes, Hsp27 and TPI-1 emerged as potential candidates for the differentiation and prognosis in RCC.
Keywords: Hsp27; Renal cell carcinoma; TPI-1; biomarker; protein profiling; proteomics.
Conflict of interest statement
Conflict of Interest: The authors have declared that no conflict of interest exists.
Figures
References
-
- Jemal A, Siegel R, Ward E. et al.Cancer Statistics, 2008. CA Cancer J Clin. 2008;58:71–96. - PubMed
-
- Reuter V, Tickoo SK. Adult Renal Tumors. In: Sternberg SS, Mills SE, Carter D, editors. Sternberg's diagnostic surgical pathology, 4th edn. Philadelphia: Lippincott Williams & Wilkins; 2004. pp. 2710–2775.
-
- Grignon DJ. Kidney Tumors in Adults. In: Murphy WM, Grignon DJ, Perlman EJ, editors. Tumors of the kidney, bladder, and related urinary structures; AFIP atlas of tumor pathology; Fourth series. Washington DC: American Registry of Pathology; 2004. p. 394.
-
- Grignon D. Pathology of Kidney Tumors. In: Mydlo JH, editor. Renal cancer: methods and protocols. Totowa, N.J: Humana Press; 2001. pp. 35–51. - PubMed
-
- Linehan WM, Vasselli J, Srinivasan R. et al.Genetic basis of cancer of the kidney: disease-specific approaches to therapy. Clin Cancer Res. 2004;10:6282S–6289S. - PubMed
LinkOut - more resources
Full Text Sources
Other Literature Sources
Research Materials
Miscellaneous
