. 2010 Oct 21;6(10):e1001168.
doi: 10.1371/journal.pgen.1001168.

Loss of the p53/p63 regulated desmosomal protein Perp promotes tumorigenesis

Affiliations

Loss of the p53/p63 regulated desmosomal protein Perp promotes tumorigenesis

Veronica G Beaudry et al. PLoS Genet. .

Abstract

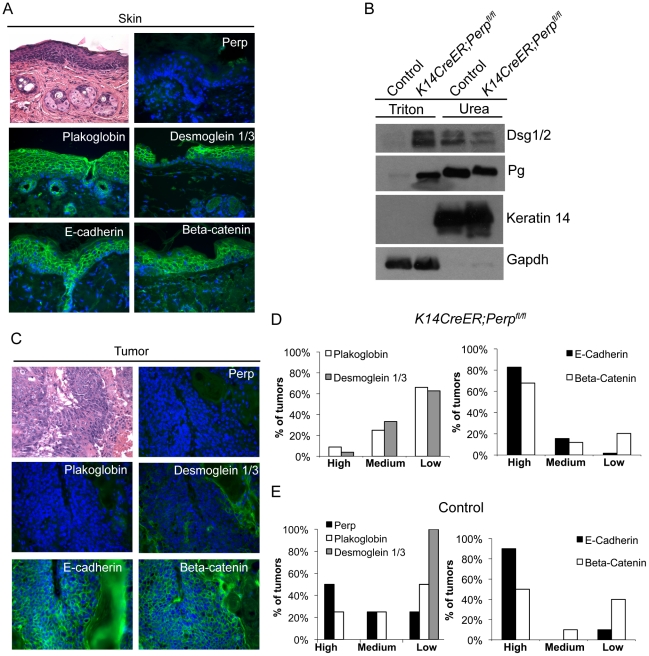
Dysregulated cell-cell adhesion plays a critical role in epithelial cancer development. Studies of human and mouse cancers have indicated that loss of adhesion complexes known as adherens junctions contributes to tumor progression and metastasis. In contrast, little is known regarding the role of the related cell-cell adhesion junction, the desmosome, during cancer development. Studies analyzing expression of desmosome components during human cancer progression have yielded conflicting results, and therefore genetic studies using knockout mice to examine the functional consequence of desmosome inactivation for tumorigenesis are essential for elucidating the role of desmosomes in cancer development. Here, we investigate the consequences of desmosome loss for carcinogenesis by analyzing conditional knockout mice lacking Perp, a p53/p63 regulated gene that encodes an important component of desmosomes. Analysis of Perp-deficient mice in a UVB-induced squamous cell skin carcinoma model reveals that Perp ablation promotes both tumor initiation and progression. Tumor development is associated with inactivation of both of Perp's known functions, in apoptosis and cell-cell adhesion. Interestingly, Perp-deficient tumors exhibit widespread downregulation of desmosomal constituents while adherens junctions remain intact, suggesting that desmosome loss is a specific event important for tumorigenesis rather than a reflection of a general change in differentiation status. Similarly, human squamous cell carcinomas display loss of PERP expression with retention of adherens junctions components, indicating that this is a relevant stage of human cancer development. Using gene expression profiling, we show further that Perp loss induces a set of inflammation-related genes that could stimulate tumorigenesis. Together, these studies suggest that Perp-deficiency promotes cancer by enhancing cell survival, desmosome loss, and inflammation, and they highlight a fundamental role for Perp and desmosomes in tumor suppression. An understanding of the factors affecting cancer progression is important for ultimately improving the diagnosis, prognostication, and treatment of cancer.


Conflict of interest statement

The authors have declared that no competing interests exist.

Figures

Figure 1
Figure 1. Perp-deficiency promotes tumorigenesis.
A) Perp immunofluorescence images demonstrating the presence of Perp in the epidermis of control mice and the loss of Perp in the epidermis of K14CreER;Perpfl/fl mice. Green signal represents Perp staining, red signal represents staining for the desmosomal protein Desmoplakin (Dp), and blue signal represents DAPI, to mark nuclei. (Upper left) Low magnification images show an overview of the epidermis, and (Upper right) high magnification images show the punctate staining pattern typical of desmosomal proteins. (Lower panel) Punctate desmosomal pattern in the epidermis is comparable to that observed in wild-type mouse keratinocyte monolayers. B) Tumor study design. C) Kaplan-Meier analysis showing tumor latency in UVB-treated control (Perpfl/fl and Perpfl/+) and K14CreER;Perpfl/fl mice. Statistical significance was determined using the Log Rank test (* p = 0.0002). n =  25 for each genotype. D) (Left) Graph depicts the average number of SCCs per UVB-treated mouse +/− STDEV. Statistical analysis was performed using the Student's unpaired t-test (* p =  0.00049). (Right) Representative photographs of tumor burden in control and K14CreER;Perpfl/fl mice, with arrow indicating a tumor. E) Representative Hematoxylin and Eosin (H&E) stained images illustrating the various SCC grades. F) Table indicating the numbers of SCCs of different grades in UVB-treated control and K14CreER;Perpfl/fl mice.
Figure 2
Figure 2. Perp loss compromises UVB-induced apoptosis in vivo and in vitro.
A) Perp immunohistochemistry showing loss of Perp in the epidermis of tamoxifen-treated K14CreER;Perpfl/fl mice. Dashed line demarcates epidermis (EP) and dermis (D). B) Immunohistochemistry showing p53 stabilization (arrows) in the epidermis of both control and K14CreER;Perpfl/fl mice 24 hrs after treatment with 2.5 kJ/m2 UVB radiation. C) Cleaved Caspase 3 (CC3) immunohistochemistry to detect apoptosis in the epidermis of untreated and UVB-treated mice of different genotypes. Arrows indicate apoptotic cells. D) Quantification of apoptosis in untreated and UVB-treated control, K14CreER;Perpfl/fl, and p53−/− mice. Graph depicts the average number of cleaved Caspase 3 (CC3)- positive cells per linear cm of epidermis, +/− SEM. Data were derived from the analysis of segments of skin at least 2–3 cm long per mouse, in several independent experiments with the following numbers of mice: wild-type controls (n = 8), K14CreER;Perpfl/fl (n = 12), p53−/− (n = 5). Statistical analysis was conducted using the Student's unpaired t-test (* p = 0.0017 versus treated wild-type and ** p = 0.0003 versus treated wild-type). (E) Representative immunofluorescence images of wild-type, Perp−/−, and p53−/− keratinocyte monolayers, either untreated or treated with 1 kJ/m2 UVB, and stained with a cleaved Caspase 3 antibody and DAPI to measure apoptosis. (F) Higher magnification images show apoptotic cells, which display both cleaved Caspase 3-positivity and nuclear blebbing and chromatin condensation by DAPI staining, hallmarks of apoptosis (G) Quantitation of the percentage of apoptotic cells per 200× field in untreated and UVB-treated wild-type, Perp−/−, and p53−/− keratinocytes, as assessed by cleaved Caspase 3/DAPI staining. Graph represents the average +/− SEM of three independent experiments performed in triplicate. Statistical analysis was conducted using the Student's unpaired t-test. (* p = 0.011 versus treated wild-type and ** p = 0.0029 versus treated wild-type).
Figure 3
Figure 3. Adhesion junction analysis in tumors from K14CreER;Perpfl/fl and control mice.
A) Representative Hematoxylin and Eosin (H&E) staining and immunofluorescence images of desmosome and adherens junction component protein expression in skin from tamoxifen-treated K14CreER;Perpfl/fl mice demonstrating that Perp loss itself does not disrupt membrane expression of other adhesion proteins. B) Western blot analysis showing both the Triton X-100-soluble and urea-only soluble fractions of mouse epidermal lysates from control and K14CreER;Perpfl/fl mice. Desmoglein 1/2 (Dsg 1/2) and Plakoglobin (Pg) solubility were examined. Gapdh serves as a loading control for the Triton X-100-soluble pool, while Keratin 14 serves as the loading control for the urea fraction. C, D) Tumors from K14CreER;Perpfl/fl mice were stained with antibodies against various desmosomal and adherens junction components, and both the percentage of epithelial cells staining positive for each marker and the intensity of staining were measured. Staining for each antigen was categorized as high (>70%), medium (30–70%), or low (<30%) level expression. C) Representative H&E and immunofluorescence images of a K14CreER;Perpfl/fl tumor sample demonstrating desmosomal component loss with retention of adherens junction components. Green signal indicates antigen staining, and blue signal indicates DAPI-marked nuclei. D) (Left) Graph showing the percentages of K14CreER;Perpfl/fl tumors categorized into respective groups based on quantitative immunofluorescence staining for Plakoglobin and Desmoglein 1/3. (Right) Graph depicting the percentages of tumors categorized into respective groups based on immunofluorescence staining for E-cadherin and Beta-catenin. (E) Tumors from control wild-type mice were stained for desmosomal and adherens junction components, and each component was categorized as displaying high, medium, or low level expression, as described above. (Left) Graph showing the percentages of control tumors categorized into respective groups based on quantitative immunofluorescence staining for Perp, Plakoglobin, and Desmoglein 1/3. (Right) Graph depicting the percentages of tumors categorized into respective groups based on immunofluorescence staining for E-cadherin and Beta-catenin.
Figure 4
Figure 4. PERP loss with E-cadherin maintenance is a common event in human skin SCCs.
A) Representative PERP and E-cadherin immunostaining of SCCs illustrating different expression patterns at low (left 100∶1) and high (right 400∶1) power magnification. Examples of PERP+;E- cadherin+ (i), PERP−;E-cadherin− (ii), and PERP−;E- cadherin+ (iii) tumors are shown. Dashed boxes indicate regions shown in the high magnification images. B) Table quantifying the numbers and percentages of SCCs with specific staining patterns for PERP and E- cadherin expression. Note the high percentage of tumors exhibiting strong E-cadherin staining, but no PERP staining.
Figure 5
Figure 5. Perp-deficiency induces expression of inflammation-related genes.
A) Perp immunofluorescence demonstrating Perp loss in the epidermis of K14CreER;Perpfl/fl mice two weeks after tamoxifen injection. B) Genes differentially expressed between control K14CreER;wild-type and K14CreER;Perpfl/fl skin were identified using SAM (Significance Analysis of Microarrays) with an FDR of 10%. The 143 genes (51 induced and 92 repressed in Perp-deficient skin compared to control skin) are grouped by hierarchical clustering and represented in the heat map. C) Major classes of genes upregulated and downregulated in K14CreER;Perpfl/fl skin compared to controls, as determined by Gene Ontology (GO) annotation. Members of the metabolic process, transport, immune system process, developmental process, and cell communication categories were statistically significantly enriched (p =  6.73×10⁻⁴, p =  3.52×10⁻³, p =  8.91×10⁻³; p =  1.59×10⁻², p =  2.47×10⁻², respectively, by the binomial statistic). D) Table of genes induced 3 fold or greater in K14CreER;Perpfl/fl skin relative to control samples. E) Quantitative-RT-PCR analysis validating Il1f6 (* p = 3.1×10⁻⁵), s100a9 (* p = 0.00022), Chi3l1 (* p =  1.2×10⁻⁶), and Ccl20 (* p = 0.0002) as genes induced upon Perp loss. Graphs represent the average expression levels in the skin of five mice examined in triplicate +/− SEM. Statistical significance was calculated using the Student's unpaired t-test. F) Representative immunofluorescence images of CD3-positive T-cells in control versus K14CreER;Perpfl/fl mouse skin. T-cells are stained in green (arrows) and nuclei are stained with DAPI in blue. EP indicates epidermis and D indicates dermis, with white dashed line delineating the boundary between the two compartments. G) Quantification of CD3-positive T-cells in the skin of control and K14CreER;Perpfl/fl mice. Graph represents the average number of CD3-positive T-cells counted in triplicate 200× fields, from the skin of each of at least 5 mice, +/− SEM. Statistical significance was analyzed using the Student's unpaired t-test. (p = 0.21). H) Representative images of staining for toluidine blue-positive mast cells in control and K14CreER;Perpfl/fl mouse skin. Dashed box represents area seen in higher magnification (400∶1) images below. Note that mast cells are identified by the purple stain (arrows), which differs from the blue stained background due to pH differences within mast cells. I) Quantification of mast cell numbers in the skin of control and K14CreER;Perpfl/fl mice. Graph represents the average number of mast cells counted in triplicate 200× fields, from the skin of each of 5 mice, +/− SEM. (p = 0.7; Student's unpaired t-test).
Figure 6
Figure 6. Combined Perp-deficiency and chronic UVB exposure induce immune cell infiltration in the skin.
A) Representative immunofluorescence images of myeloid cells, as determined by MPO staining (arrows), in the skin of control and K14CreER;Perpfl/fl mice treated with UVB light for 19 weeks. B) Quantification of MPO-positive cells in UVB-treated cohorts. Graph represents the average of 3 mice, quantified in triplicate 200× fields +/− SEM. (p = 0.89; Student's unpaired t-test). C) Representative immunofluorescence images of T-cells, as assessed by CD3 staining (arrows), in the skin of control and K14CreER;Perpfl/fl mice treated with UVB light for 19 weeks. D) Quantification of CD3-positive T-cell numbers in UVB-treated cohorts. Graph represents the average number of T-cells in the skin of 3 mice, quantified in triplicate 200× fields, +/− SEM. (* p =  0.044, Student's unpaired t-test). E) Representative images of staining for mast cells, as assessed by toluidine blue-positivity (arrows), in the skin of control and K14CreER;Perpfl/fl mice treated with UVB light for 19 weeks. Note the increase in mast cells underlying the epidermis in the K14CreER;Perpfl/fl mice. F) Quantification of mast cells in UVB-treated cohorts. Graph represents the average of 3 mice, quantified in triplicate 200× fields +/− SEM. (* p =  0.0092; Student's unpaired t-test).
Figure 7
Figure 7. Model for how Perp-deficiency can promote tumorigenesis.
Perp loss, combined with chronic UVB exposure, can promote cancer through three mechanisms. A) Compromised apoptosis in the epidermis of Perp-deficient mice in response to UVB light can lead to inappropriate survival of cells sustaining DNA damage and expansion of pre-malignant cells. B) Impaired desmosomal adhesion in Perp-deficient mice, depicted by downregulation of a desmosomal cadherin, can facilitate the complete disruption of desmosomes that stimulates tumorigenesis. The exact placement of Perp, a tetraspan membrane protein, within the desmosome is speculative. C) The recruitment of inflammatory cells to the skin of UVB-treated Perp-deficient mice can promote cancer through mechanisms such as enhancing remodeling of the tumor microenvironment or stimulating angiogenesis.

References

    1. Cooper GM. Oncogenes. Boston: Jones and Bartlett Publishers; 1995. p. xv, 384.
    1. Alam M, Ratner D. Cutaneous squamous-cell carcinoma. N Engl J Med. 2001;344:975–983. - PubMed
    1. Hunter KD, Parkinson EK, Harrison PR. Profiling early head and neck cancer. Nat Rev Cancer. 2005;5:127–135. - PubMed
    1. Fuchs E, Raghavan S. Getting under the skin of epidermal morphogenesis. Nat Rev Genet. 2002;3:199–209. - PubMed
    1. Green KJ, Gaudry CA. Are desmosomes more than tethers for intermediate filaments? Nat Rev Mol Cell Biol. 2000;1:208–216. - PubMed

Publication types

MeSH terms