. 2010 Oct 20;5(10):e13450.
doi: 10.1371/journal.pone.0013450.

Chronic hypoxia impairs muscle function in the Drosophila model of Duchenne's muscular dystrophy (DMD)

Affiliations

Chronic hypoxia impairs muscle function in the Drosophila model of Duchenne's muscular dystrophy (DMD)

Matias Mosqueira et al. PLoS One. .

Abstract

Duchenne's muscular dystrophy (DMD) is a severe progressive myopathy caused by mutations in the DMD gene leading to a deficiency of the dystrophin protein. Due to ongoing muscle necrosis in respiratory muscles late-stage DMD is associated with respiratory insufficiency and chronic hypoxia (CH). To understand the effects of CH on dystrophin-deficient muscle in vivo, we exposed the Drosophila model for DMD (dmDys) to CH during a 16-day ascent to the summit of Mount Denali/McKinley (6194 meters above sea level). Additionally, dmDys and wild type (WT) flies were also exposed to CH in laboratory simulations of high altitude hypoxia. Expression profiling was performed using Affymetrix GeneChips® and validated using qPCR. Hypoxic dmDys differentially expressed 1281 genes, whereas the hypoxic WT flies differentially expressed 56 genes. Interestingly, a number of genes (e.g. heat shock proteins) were discordantly regulated in response to CH between dmDys and WT. We tested the possibility that the disparate molecular responses of dystrophin-deficient tissues to CH could adversely affect muscle by performing functional assays in vivo. Normoxic and CH WT and dmDys flies were challenged with acute hypoxia and time-to-recover determined as well as subjected to climbing tests. Impaired performance was noted for CH-dmDys compared to normoxic dmDys or WT flies (rank order: Normoxic-WT ≈ CH-WT> Normoxic-dmDys> CH-dmDys). These data suggest that dystrophin-deficiency is associated with a disparate, pathological hypoxic stress response(s) and is more sensitive to hypoxia induced muscle dysfunction in vivo. We hypothesize that targeting/correcting the disparate molecular response(s) to hypoxia may offer a novel therapeutic strategy in DMD.


Conflict of interest statement

Competing Interests: The authors have declared that no competing interests exist.

Figures

Figure 1
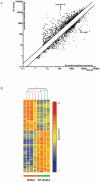
Figure 1. Differential expression of transcripts in dmDys exposed to chronic hypoxia.
A) Scatter graph of log10 expression values of differentially expressed genes. Each individual point on the scatter graph represents a probe set that met the statistical and two-fold differential expression cut offs used in this study. Parallel lines show the 2 fold cutoff. Genes lying furthest off the diagonal exhibit greatest expression differences between CH-dmDys and normoxic dmDys. The arrows indicate representative differentially expressed genes used for validation. B) Graphical representation of all 1281 transcripts that were differentially expressed in CH-dmDys and normoxic dmDys. The four CH-dmDys and four dmDys GeneChip data sets can be seen to cluster into two distinct groups based on correlation of gene expression pattern. The branches lengths for CH-dmDys and dmDys subtrees seen at the top are based on normalized raw data of all transcripts and quantitatively demonstrate that the four samples are closely related to each other, as are the four dmDys samples. Each horizontal colored bar represents one probe set, and the color of the bar determines the degree of expression (red  =  up-regulated genes; blue  =  down-regulated genes; yellow  =  no differentially regulated genes).
Figure 2
Figure 2. Validation of differential expression of five genes detected on CH-dmDys profile by real time RT-PCR.
Five out of top 10 differentially expressed genes were amplified using cDNA from four independent RNA preparations and analyzed by qPCR. Graph shows concordant changes of gene expression levels for various genes noted on microarrays (unfilled bars) and validated by qPCR (filled bars).
Figure 3
Figure 3. Differential expression of transcripts in WT exposed to chronic hypoxia.
A) Scatter graph log10 expression values of differentially expressed genes. Each individual point on the scatter graph represents a probe set that met the statistical and two-fold differential expression cut offs used in this study. Parallel lines show the 2 fold cutoff. Genes lying furthest off the diagonal exhibit greatest expression differences between CH-WT and normoxic WT. The arrows indicate representative differentially expressed genes used for validation. B) Graphical representation of all 56 transcripts that were differentially expressed in CH-WT and normoxic WT. The four CH-WT and four WT GeneChip data sets can be seen to cluster into two distinct groups based on correlation of gene expression pattern. The branches lengths for CH-WT and WT subtrees seen at the top are based on normalized raw data of all transcripts and quantitatively demonstrate that the four samples are closely related to each other, as are the four WT samples. Each horizontal colored bar represents one probe set, and the color of the bar determines the degree of expression (red  =  up-regulated genes; blue  =  down-regulated genes; yellow  =  no differentially regulated genes).
Figure 4
Figure 4. Validation of differential expression of five genes detected on WT profile by real time RT-PCR.
Five out of top 10 differentially expressed genes were amplified using cDNA from four independent RNA preparations and analyzed by qPCR. Graph shows concordant changes of gene expression levels for various genes noted on microarrays (unfilled bars) and validated by qPCR (filled bars).
Figure 5
Figure 5. Venn diagram of comparison gene expression profile between dmDys and WT flies exposed to CH.
From 1281 differentially expressed genes in dmDys and 56 in WT flies, 20 genes were found to be in common; among them, 10 genes were concordantly regulated in both profiles, while 10 were discordantly regulated in the profiles.
Figure 6
Figure 6. Time of recovery from severe hypoxic challenge assay.
The dmDysC-term flies were exposed either to normoxia (triangle) or CH (square) following the hypoxia protocol. Then, the flies were exposed for 2 hours under 1% FiO2 and then to room air. The starting time was considered as the moment when the normoxia was reestablished and a complete recovery was considered when the fly climbed the vial. The driver P-tub-Gal4 was used as control. Five vials from each genotype were used containing 20 flies per vial. The dotted line shows the median recovery time in seconds of the assay. *** p<0.001 dmDys vs. WT. # p<0.05 from CH-dmDys vs. normoxic dmDys.

Similar articles

Cited by

References

    1. Engel AG, Franzini-Armstrong C. New York: McGraw-Hill; 1994. Myology.
    1. Hoffman EP, Brown RH, Kunkel LM. Dystrophin: the protein product of the Duchene muscular dystrophy locus. Cell. 1987;51:919–928. - PubMed
    1. Koenig M, Monaco AP, Kunkel LM. The complete sequence of dystrophin predicts a rod-shaped cytoskeletal protein. Cell. 1988;53:219–226. - PubMed
    1. Bach JR, Ishikawa Y, Kim H. Prevention of pulmonary morbidity for patients with Duchenne muscular dystrophy. Chest. 1997;112:1024–1028. - PubMed
    1. Inkley SR, Oldenburg FC, Vignos PJ., Jr Pulmonary function in Duchenne muscular dystrophy related to stage of disease. Am J Med. 1974;56:297–306. - PubMed

Publication types

MeSH terms