. 2010 Oct 20;5(10):e13506.
doi: 10.1371/journal.pone.0013506.

Automatic versus voluntary motor imitation: effect of visual context and stimulus velocity

Affiliations

Automatic versus voluntary motor imitation: effect of visual context and stimulus velocity

Ambra Bisio et al. PLoS One. .

Abstract

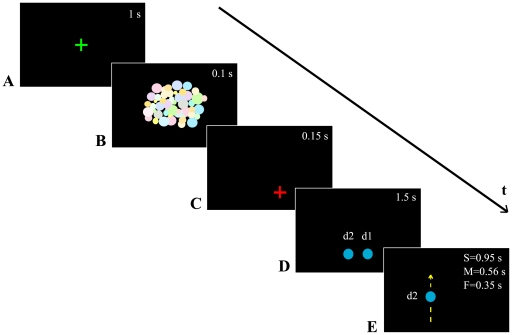
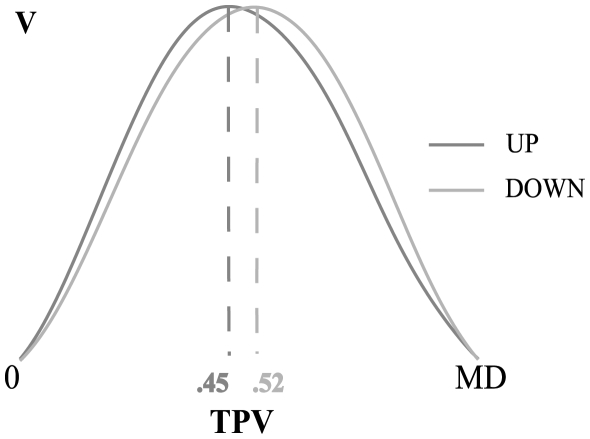
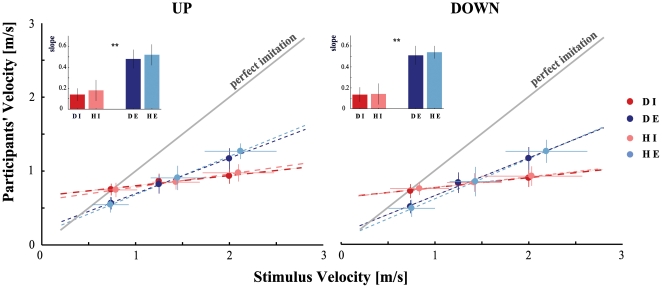
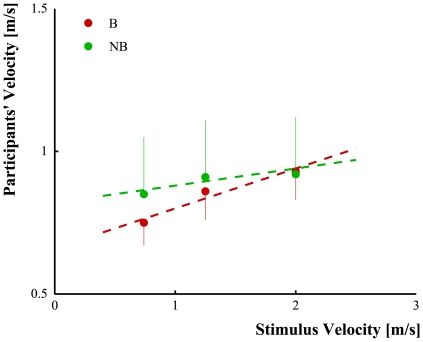
Automatic imitation is the tendency to reproduce observed actions involuntarily. Though this topic has been widely treated, at present little is known about the automatic imitation of the kinematic features of an observed movement. The present study was designed to understand if the kinematics of a previously seen stimulus primes the executed action, and if this effect is sensitive to the kinds of stimuli presented. We proposed a simple imitation paradigm in which a dot or a human demonstrator moved in front of the participant who was instructed either to reach the final position of the stimulus or to imitate its motion with his or her right arm. Participants' movements were automatically contaminated by stimulus velocity when it moved according to biological laws, suggesting that automatic imitation was kinematic dependent. Despite that the performance, in term of reproduced velocity, improved in a context of voluntary imitation, subjects did not replicate the observed motions exactly. These effects were not affected by the kind of stimuli used, i.e., motor responses were influenced in the same manner after dot or human observation. These findings support the existence of low-level sensory-motor matching mechanisms that work on movement planning and represent the basis for higher levels of social interaction.


Conflict of interest statement

Competing Interests: The authors have declared that no competing interests exist.

Figures

Figure 1
Figure 1. Sequence of visual stimuli.
A. A green cross was the alert signal that a new trial was going to start. B. 400 random disks different in size, colour, and position, appeared. C. a red cross was displayed at the starting position of the movement for 150 ms. D. The red cross was substituted by d1 and d2 appeared on the left of d1 at the same time. E. d1 disappeared when d2 started to move upwards (as in this figure) or downwards. The white numbers in each box indicate the duration of the associated stimuli. In D the duration varies with respect to the experimental condition. The dimensions of the stimuli in this figure do not respect the real dimensions.
Figure 2
Figure 2. Preliminary experiment, velocity profile.
Upward (dark grey) and downward (light grey) movement velocity profile of a typical subject, normalized on amplitude and duration (MD). On the bottom the Time to Peak Velocity values (TPV) of these movements are reported.
Figure 3
Figure 3. Linear relationship between participant (y-axis) and stimuli velocities (x-axis).
Left and right panels refer to upward and downward pointing movements, respectively. The colours code the Task and the Stimulus observed. The red scale refers to implicit task (I) and the blue scale refers to explicit task (E). Light colours represent responses to the human (H) and dark colours to the dot (D). The y = x grey line indicates the theoretical perfect imitation of the stimulus motion velocity: data above (below) this line correspond to an overestimation (underestimation) of the observed movement velocity. The vertical error bars represent standard deviations. It can be noted that the demonstrator velocity was actually inaccurate in reproducing the dot's velocities (see the horizontal error bars). The dashed lines represent the results of the linear regression model applied on the data for each experimental condition. The two insertions represent slope values (y-axis) and statistics. ** indicates a statistically significant effect (p<0.01) of the Task factor (I vs. E), regardless of the stimuli presented.
Figure 4
Figure 4. Differences in movement execution after the observation of biological (red circles) and non-biological (violating biological laws, green circles) motions: linear relationship between participant (y-axis) and stimuli velocities (x-axis) for upward movements in implicit task.
The circles represent participants' movement velocities after observing the moving stimuli and the vertical error bars refer to the standard deviations values. The dashed lines are the results of the linear regression model applied on the data.

Similar articles

Cited by

References

    1. Meltzoff AN, Moore MK. Imitation of Facial and Manual Gestures by Human Neonates. Science. 1977;198:75–78. - PubMed
    1. Chartrand TL, Bargh JA. The chameleon effect: the perception-behavior link and social interaction. J Pers Soc Psychol. 1999;76:893–910. - PubMed
    1. Byrne RW, Russon AE. Learning by imitation: a hierarchical approach. Behav Brain Sci. 1998;21:667–84; discussion 684–721. - PubMed
    1. Wohlschläger A, Gattis M, Bekkering H. Action generation and action perception in imitation: an instance of the ideomotor principle. Philos Trans R Soc Lond B Biol Sci. 2003;358:501–515. - PMC - PubMed
    1. Rizzolatti G, Fogassi L, Gallese V. Neurophysiological mechanisms underlying the understanding and imitation of action. Nat Rev Neurosci. 2001;2:661–670. - PubMed