

Intertwining threshold settings, biological data and database knowledge to optimize the selection of differentially expressed genes from microarray
- PMID: 20976008
- PMCID: PMC2958130
- DOI: 10.1371/journal.pone.0013518
Intertwining threshold settings, biological data and database knowledge to optimize the selection of differentially expressed genes from microarray
Abstract
Background: Many tools used to analyze microarrays in different conditions have been described. However, the integration of deregulated genes within coherent metabolic pathways is lacking. Currently no objective selection criterion based on biological functions exists to determine a threshold demonstrating that a gene is indeed differentially expressed.
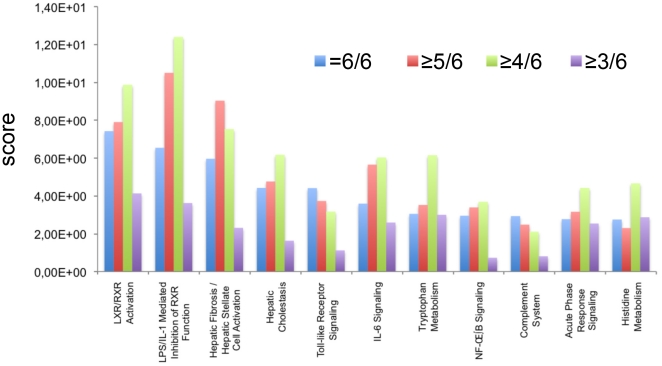
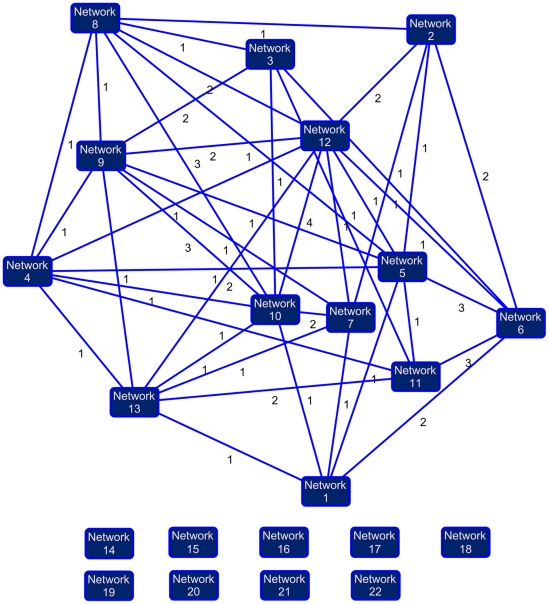
Methodology/principal findings: To improve transcriptomic analysis of microarrays, we propose a new statistical approach that takes into account biological parameters. We present an iterative method to optimise the selection of differentially expressed genes in two experimental conditions. The stringency level of gene selection was associated simultaneously with the p-value of expression variation and the occurrence rate parameter associated with the percentage of donors whose transcriptomic profile is similar. Our method intertwines stringency level settings, biological data and a knowledge database to highlight molecular interactions using networks and pathways. Analysis performed during iterations helped us to select the optimal threshold required for the most pertinent selection of differentially expressed genes.
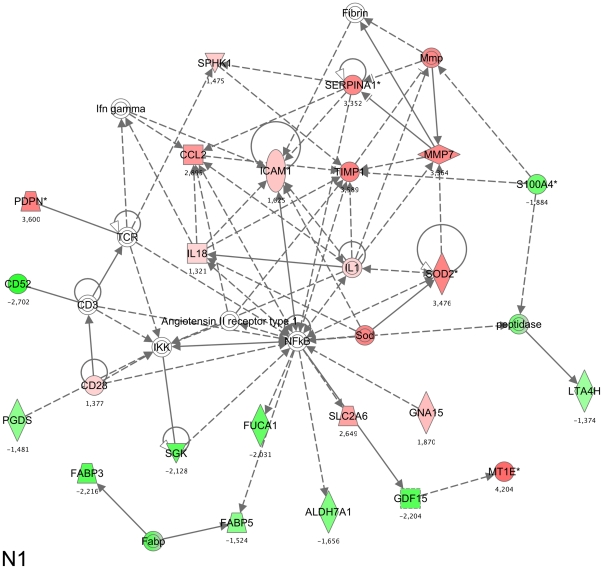
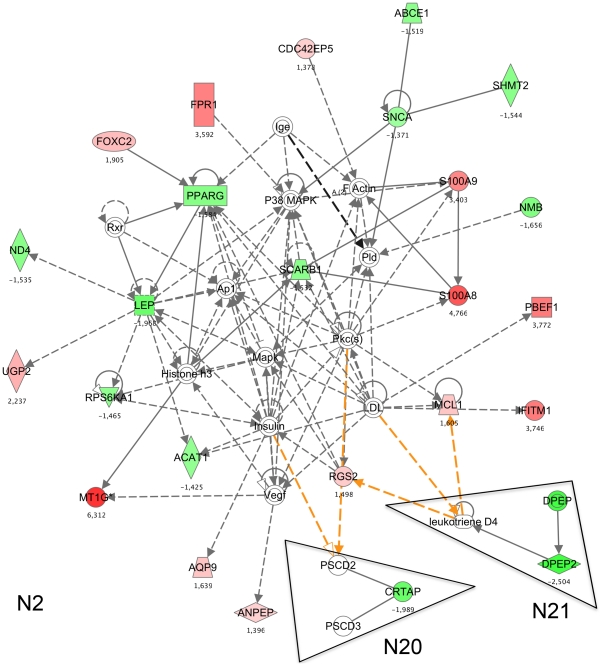
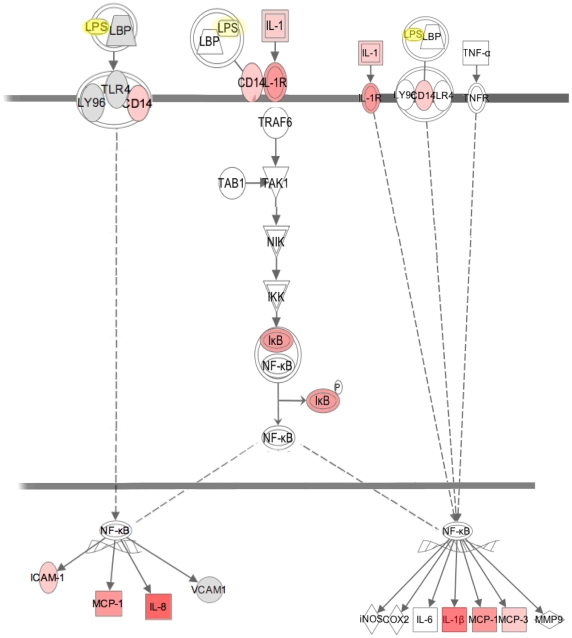
Conclusions/significance: We have applied this approach to the well documented mechanism of human macrophage response to lipopolysaccharide stimulation. We thus verified that our method was able to determine with the highest degree of accuracy the best threshold for selecting genes that are truly differentially expressed.
Conflict of interest statement
Figures
Similar articles
-
Selection of differentially expressed genes in microarray data analysis.Pharmacogenomics J. 2007 Jun;7(3):212-20. doi: 10.1038/sj.tpj.6500412. Epub 2006 Aug 29. Pharmacogenomics J. 2007. PMID: 16940966
-
Microarray data analysis: a practical approach for selecting differentially expressed genes.Genome Biol. 2001;2(12):PREPRINT0009. doi: 10.1186/gb-2001-2-12-preprint0009. Epub 2001 Nov 16. Genome Biol. 2001. PMID: 11790248
-
AffyMiner: mining differentially expressed genes and biological knowledge in GeneChip microarray data.BMC Bioinformatics. 2006 Dec 12;7 Suppl 4(Suppl 4):S26. doi: 10.1186/1471-2105-7-S4-S26. BMC Bioinformatics. 2006. PMID: 17217519 Free PMC article.
-
The Global Error Assessment (GEA) model for the selection of differentially expressed genes in microarray data.Bioinformatics. 2004 Nov 1;20(16):2726-37. doi: 10.1093/bioinformatics/bth319. Epub 2004 May 14. Bioinformatics. 2004. PMID: 15145801
-
[Transcriptomes for serial analysis of gene expression].J Soc Biol. 2002;196(4):303-7. J Soc Biol. 2002. PMID: 12645300 Review. French.
Cited by
-
p16INK4a and its regulator miR-24 link senescence and chondrocyte terminal differentiation-associated matrix remodeling in osteoarthritis.Arthritis Res Ther. 2014 Feb 27;16(1):R58. doi: 10.1186/ar4494. Arthritis Res Ther. 2014. PMID: 24572376 Free PMC article.
-
Literature aided determination of data quality and statistical significance threshold for gene expression studies.BMC Genomics. 2012;13 Suppl 8(Suppl 8):S23. doi: 10.1186/1471-2164-13-S8-S23. Epub 2012 Dec 17. BMC Genomics. 2012. PMID: 23282414 Free PMC article.
-
Promyelocytic leukemia zinc-finger induction signs mesenchymal stem cell commitment: identification of a key marker for stemness maintenance?Stem Cell Res Ther. 2014 Feb 24;5(1):27. doi: 10.1186/scrt416. Stem Cell Res Ther. 2014. PMID: 24564963 Free PMC article.
-
Involvement of angiopoietin-like 4 in matrix remodeling during chondrogenic differentiation of mesenchymal stem cells.J Biol Chem. 2014 Mar 21;289(12):8402-12. doi: 10.1074/jbc.M113.539825. Epub 2014 Feb 6. J Biol Chem. 2014. PMID: 24505142 Free PMC article.
-
Intra- and inter-individual variance of gene expression in clinical studies.PLoS One. 2012;7(6):e38650. doi: 10.1371/journal.pone.0038650. Epub 2012 Jun 18. PLoS One. 2012. PMID: 22723873 Free PMC article.
References
-
- DeRisi JL, Iyer VR, Brown PO. Exploring the metabolic and genetic control of gene expression on a genomic scale of outstanding interest. Science. 1997;278:680–686. - PubMed
-
- Pollack JR, Perou CM, Alizadeh AA, Eisen MB, Pergamenschikov A, et al. Genome-wide analysis of DNA copy-number changes using cDNA microarrays. Nat Genet. 1999;23:41–6. - PubMed
Publication types
MeSH terms
Substances
LinkOut - more resources
Full Text Sources
