. 2010 Oct 18;5(10):e13468.
doi: 10.1371/journal.pone.0013468.

AAV-mediated gene delivery in adult GM1-gangliosidosis mice corrects lysosomal storage in CNS and improves survival

Affiliations

AAV-mediated gene delivery in adult GM1-gangliosidosis mice corrects lysosomal storage in CNS and improves survival

Rena C Baek et al. PLoS One. .

Abstract

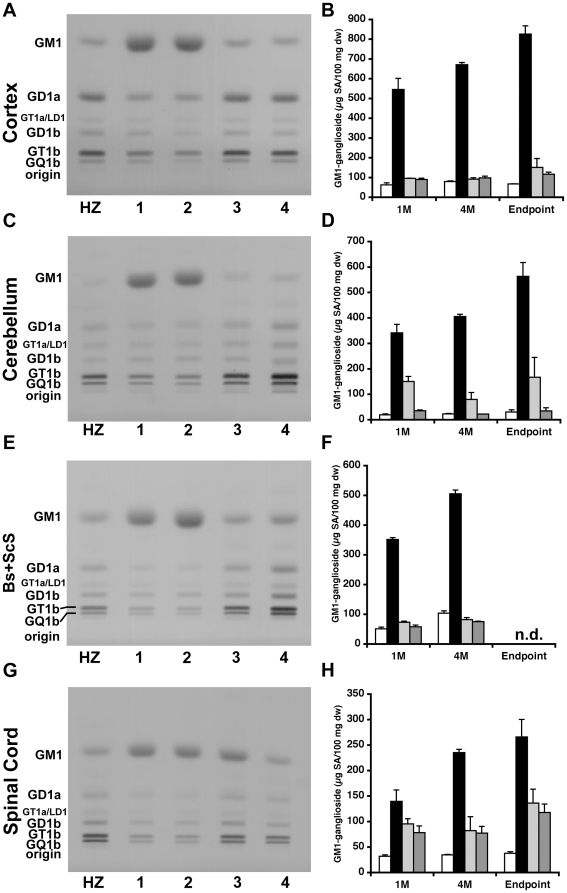
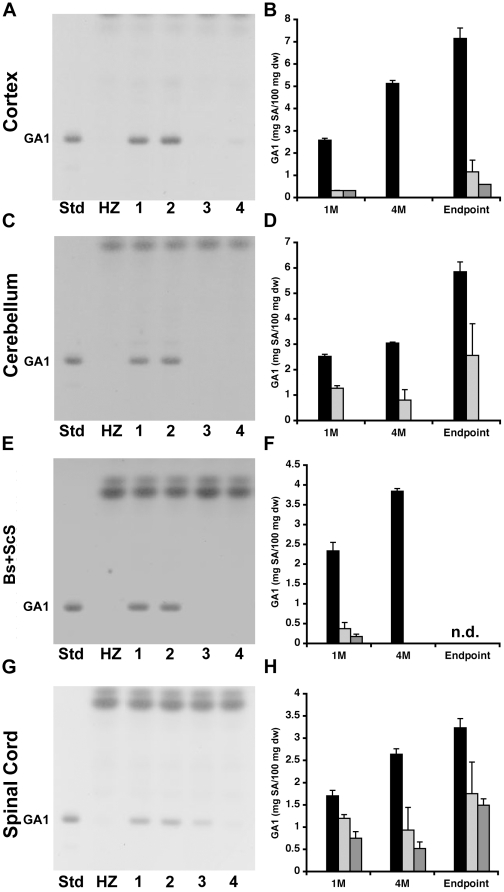
Background: GM1-gangliosidosis is a glycosphingolipid (GSL) lysosomal storage disease caused by a genetic deficiency of acid β-galactosidase (βgal), which results in the accumulation of GM1-ganglioside and its asialo-form (GA1) primarily in the CNS. Age of onset ranges from infancy to adulthood, and excessive ganglioside accumulation produces progressive neurodegeneration and psychomotor retardation in humans. Currently, there are no effective therapies for the treatment of GM1-gangliosidosis.

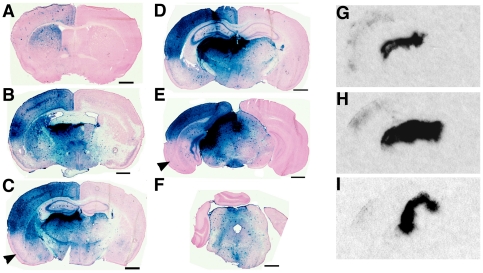
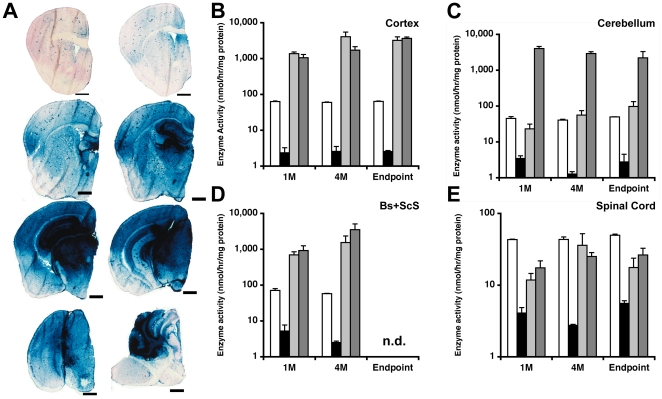
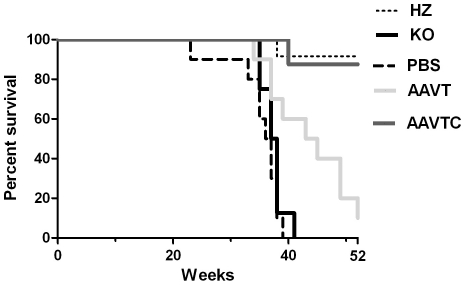
Methodology/principal findings: In this study we examined the effect of thalamic infusion of AAV2/1-βgal vector in adult GM1 mice on enzyme distribution, activity, and GSL content in the CNS, motor behavior, and survival. Six to eight week-old GM1 mice received bilateral injections of AAV vector in the thalamus, or thalamus and deep cerebellar nuclei (DCN) with pre-determined endpoints at 1 and 4 months post-injection, and the humane endpoint, or 52 weeks of age. Enzyme activity was elevated throughout the CNS of AAV-treated GM1 mice and GSL storage nearly normalized in most structures analyzed, except in the spinal cord which showed ∼50% reduction compared to age-matched untreated GM1 mice spinal cord. Survival was significantly longer in AAV-treated GM1 mice (52 wks) than in untreated mice. However the motor performance of AAV-treated GM1 mice declined over time at a rate similar to that observed in untreated GM1 mice.

Conclusions/significance: Our studies show that the AAV-modified thalamus can be used as a 'built-in' central node network for widespread distribution of lysosomal enzymes in the mouse cerebrum. In addition, this study indicates that thalamic delivery of AAV vectors should be combined with additional targets to supply the cerebellum and spinal cord with therapeutic levels of enzyme necessary to achieve complete correction of the neurological phenotype in GM1 mice.


Conflict of interest statement

Competing Interests: The authors have declared that no competing interests exist.

Figures

Figure 1
Figure 1. Distribution of βgal in the brain after AAV1-mediated thalamic gene delivery.
One µl of AAV2/1-CBA-mβgal vector (4.12×10¹³ gc/ml) was injected into the left thalamus of 6–8 week-old GM1 mice. (A–F) One month later the brain was analyzed for βgal distribution by X-gal histochemical staining. βgal staining was evident throughout the ipsilateral hemisphere. Arrowhead in (C) indicates the ipsilateral perirhinal and piriform cortices where bgal staining is less intense than elsewhere in the cortex in the same coronal plane. (G–I) Detection of vector mRNA by radioactive in situ hybridization. (G), (H), (I) show the signal detected in tissue sections adjacent to those stained for βgal activity with X-gal shown in (C), (D), and (E), respectively. Arrowheads in (C), and (E) indicate the perirhinal, piriform and entorhinal cortices. Scale bars in (A–F) represent 1mm.
Figure 2
Figure 2. β-galactosidase distribution in CNS of GM1-gangliosidosis mice after intraparenchymal infusion of AAV2/1-βgal vector.
Six to eight week-old GM1 mice received bilateral injections of AAV2/1-βgal vector (1.2×10¹³ gc/ml) into the thalamus (AAV-T; light gray bars), or thalamus and deep cerebellar nuclei (AAV-TC; dark gray bars). Age matched heterozygote (white bars) and untreated GM1 mice (black bars) were used as controls. Mice were sacrificed at 1, and 4 months post-infusion and at the humane endpoint (Endpoint). (A) The left brain hemisphere was used for histological analysis of βgal distribution by X-gal staining at pH 5.0. Representative sections from an AAV-TC GM1 mouse sacrificed at 4 months post-injection are shown. Scale bar = 1 mm. βgal activity was determined by 4MU assay in (B) cortex, (C) cerebellum, (D) brainstem+subcortical structures (Bs+ScS), and (E) spinal cord at 1 (1M) and 4 (4M) months post-injection, and at the humane endpoint (Endpoint). Error bars correspond to standard error of the mean. n.d. – not determined.
Figure 3
Figure 3. Biochemical quantification of GM1-ganglioside content in the CNS of AAV-treated GM1 mice by HPTLC.
Gangliosides were isolated from (A, B) cortex, (B, C) cerebellum, (D, E) brainstem+subcortical structures (Bs+ScS), and (F, G) spinal cord of heterozygote (HZ, white bars), untreated GM1 (1, black bars), PBS-treated GM1 (2), AAV-T GM1 (3, light gray bars), and AAV-TC GM1 (4, dark gray bars) mice. (A, C, E, G) Representative chromatograms showing the qualitative distribution of gangliosides at 4 months post-injection. The amount of gangliosides spotted per lane was approximately 1.5 µg sialic acid. The individual gangliosides were labeled according to the nomenclature system of Svennerholm (left side of the chromatograms) . (B, D, F, H) Mean concentration of GM1-ganglioside in each region of the CNS at 1 month (1M), 4 months (4M) post-injection, and at the humane or experimental endpoint (Endpoint) are shown. Error bars represent 1 SEM. n.d. – not determined.
Figure 4
Figure 4. Biochemical quantification of GA1 content in the CNS of AAV-treated GM1 mice by HPTLC.
GA1 isolated from (A, B) cortex, (B, C) cerebellum, (D, E) brainstem + subcortical structures (Bs+ScS), and (F, G) spinal cord of heterozygote (HZ, white bars*), untreated GM1 (1, black bars), PBS-treated GM1 (2), AAV-T GM1 (3, light gray bars), and AAV-TC GM1 (4, dark gray bars) mice. (A, C, E, G) Representative chromatograms for 4 months post-injection are shown. The amount of sample spotted per lane was approximately equivalent to 0.2 mg tissue dry weight. (B, D, F, H) Mean concentration of GA1 glycosphingolipid represented as mg of GA1/100 mg dry tissue weight (dw) for each region of the CNS at 1 month (1M), 4 months (4M) post-injection, and at the humane or experimental endpoint (Endpoint) are shown. Error bars represent 1 SEM. n.d. – not determined; * White bars = 0.
Figure 5
Figure 5. Disease marker gene expression in the CNS of AAV-treated GM1 mice.
Untreated GM1 mice (black bars), and AAV-T GM1 mice (light gray bars) were sacrificed at the humane endpoint defined by >20% loss in body weight, or at 52 weeks of age for AAV-TC GM1 mice (dark gray bars), and HZ mice (white bars). Total RNA was isolated from cerebrum (c), cerebellum (Cb), brainstem+subcortical structures (Bs+ScS), and spinal cord (sc) and used for real-time PCR quantification of TNF-α (A), Fas (B), MIP-1α (C), and F4/80 (D) expression levels. Average fold induction over normal (HZ levels) was calculated for each tissue. Error bars correspond to 1 SEM. * indicates statistical significance with a p-value<0.05 in Student's t-test.
Figure 6
Figure 6. Effect of AAV-treatment on motor performance of GM1 mice.
(A) Rotarod testing was performed prior to injection (0 months), and then at 1, 2.5, 4, and 6 months post-injection in AAV-T GM1 mice (•), AAV-TC GM1 (), untreated GM1 (▴), and HZ mice (⧫). Open-field testing measured (B) locomotor and (C) rearing activity at 2.5 (2.5M) and 4 (4M) months post-injection in HZ (white bars), untreated GM1 (black bars), AAV-T GM1 (light gray bars), and AAV-TC GM1 (dark gray bars) mice. Group sizes: n = 20–24 for 0 and 1 month time points; n = 14–18 for 2.5 and 4 month time points; n = 10–12 for 6 month time point. Graphs represent the mean for each group at the specified time point. Error bars correspond to 1 SEM. * p<0.05 in paired Student's t-test.
Figure 7
Figure 7. Effect of AAV treatment on visual function in GM1 mice.
Visual evoked potentials were measured in (A) wild type, (B) HZ, (C) untreated GM1, (D) AAV-T GM1, and (E) AAV-TC GM1 mice. Group sizes are indicated on the graphs. (C–E) Gray lines show the results for each mouse in the group. Black lines represent the group average.
Figure 8
Figure 8. Presence of β-galactosidase activity in the retina of AAV-treated GM1-gangliosidosis mice.
The eye was collected at the humane endpoint or 1 year of age, and βgal activity assessed by X-gal staining at pH 5.0 of histological sections from: (A) Heterozygote mice; (B) Untreated GM1 mice; (C) GM1 mice injected bilaterally in the thalamus (AAV-T group); (D) GM1 mice injected bilaterally in the thalamus and deep cerebellar nuclei (AAV-TC group). Sections were counterstained with Nuclear Fast Red reagent. Abbreviations: GCL- ganglion cell layer; INL – inner nuclear layer; ONL – outer nuclear layer. Magnification – 200×.
Figure 9
Figure 9. Kaplan-Meier survival analysis of AAV-treated GM1 mice.
Untreated GM1 (KO, black line), PBS-treated GM1 (PBS, bold dashed line), heterozygote (HZ, dashed line), AAV-T GM1 (light gray line), and AAV-TC GM1 (dark gray line) mice were allowed to survive until the humane endpoint defined by >20% body weight loss, or 52 weeks of age. N = 8–12 per group.

References

    1. Okada S, O'Brien JS. Generalized gangliosidosis: beta-galactosidase deficiency. Science. 1968;160:1002–1004. - PubMed
    1. O'Brien JS, Stern MB, Landing BH, O'Brien JK, Donnell GN. Generalized Gangliosidosis: Another Inborn Error of Ganglioside Metabolism? Am J Dis Child. 1965;109:338–346. - PubMed
    1. Suzuki Y, Oshima A, Nanba E. β-galactosidase deficiency (β-galactosidosis): GM1 gangliosidosis and Morquio B disease. In: Scriver CR, Beaudet AL, Sly WS, Valle D, editors. The Online Metabolic & Molecular Basis of Inherited Diseases. New York: McGraw-Hill; 2001. pp. 3775–3810.
    1. Bieber FR, Mortimer G, Kolodny EH, Driscoll SG. Pathologic findings in fetal GM1 gangliosidosis. Arch Neurol. 1986;43:736–738. - PubMed
    1. Kudoh T, Kikuchi K, Nakamura F, Yokoyama S, Karube K, et al. Prenatal diagnosis of GM1-gangliosidosis: biochemical manifestations in fetal tissues. Hum Genet. 1978;44:287–293. - PubMed

Publication types