. 2010 Oct 18;5(10):e13381.
doi: 10.1371/journal.pone.0013381.

A metagenomic analysis of pandemic influenza A (2009 H1N1) infection in patients from North America

Affiliations

A metagenomic analysis of pandemic influenza A (2009 H1N1) infection in patients from North America

Alexander L Greninger et al. PLoS One. .

Abstract

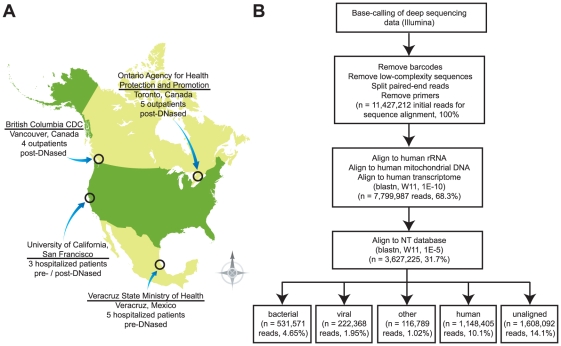
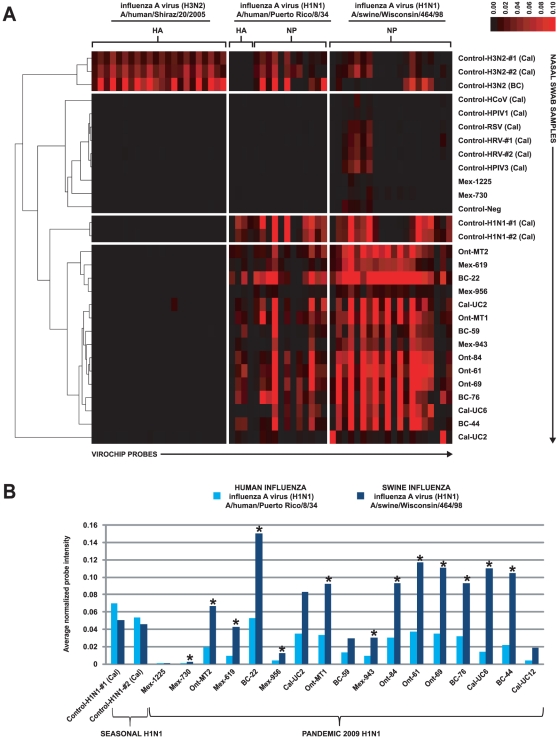
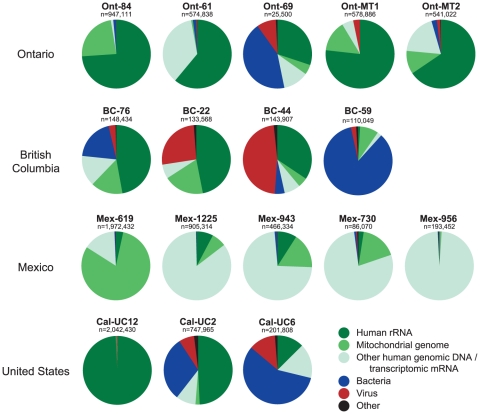
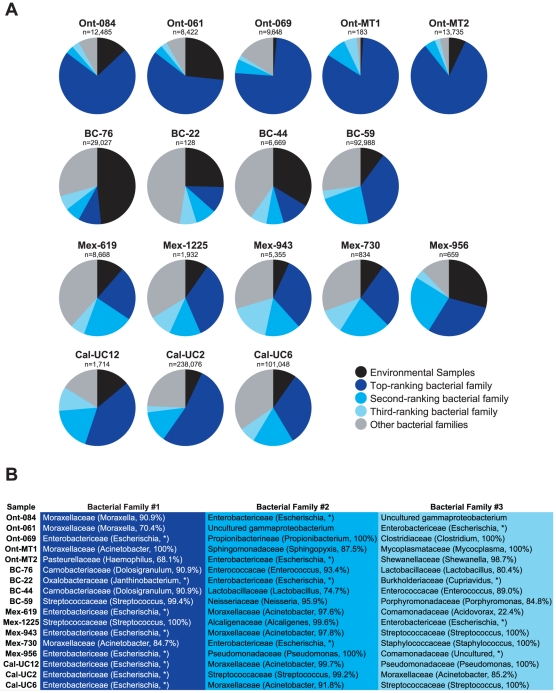
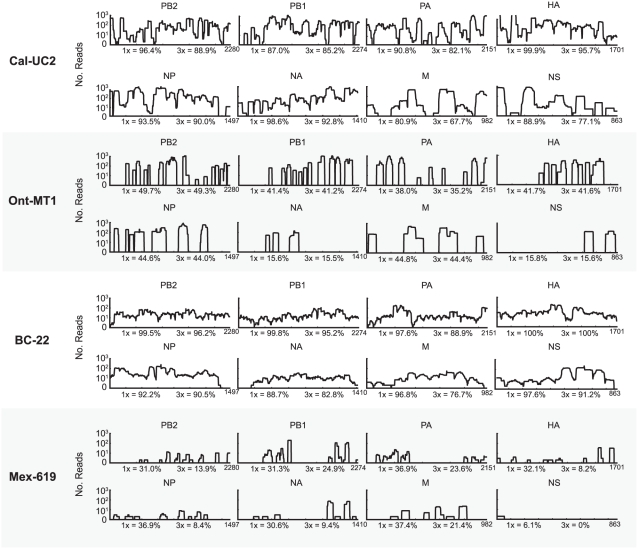
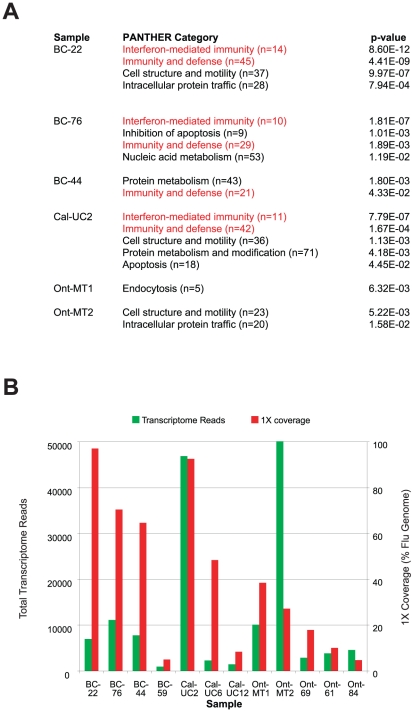
Although metagenomics has been previously employed for pathogen discovery, its cost and complexity have prevented its use as a practical front-line diagnostic for unknown infectious diseases. Here we demonstrate the utility of two metagenomics-based strategies, a pan-viral microarray (Virochip) and deep sequencing, for the identification and characterization of 2009 pandemic H1N1 influenza A virus. Using nasopharyngeal swabs collected during the earliest stages of the pandemic in Mexico, Canada, and the United States (n = 17), the Virochip was able to detect a novel virus most closely related to swine influenza viruses without a priori information. Deep sequencing yielded reads corresponding to 2009 H1N1 influenza in each sample (percentage of aligned sequences corresponding to 2009 H1N1 ranging from 0.0011% to 10.9%), with up to 97% coverage of the influenza genome in one sample. Detection of 2009 H1N1 by deep sequencing was possible even at titers near the limits of detection for specific RT-PCR, and the percentage of sequence reads was linearly correlated with virus titer. Deep sequencing also provided insights into the upper respiratory microbiota and host gene expression in response to 2009 H1N1 infection. An unbiased analysis combining sequence data from all 17 outbreak samples revealed that 90% of the 2009 H1N1 genome could be assembled de novo without the use of any reference sequence, including assembly of several near full-length genomic segments. These results indicate that a streamlined metagenomics detection strategy can potentially replace the multiple conventional diagnostic tests required to investigate an outbreak of a novel pathogen, and provide a blueprint for comprehensive diagnosis of unexplained acute illnesses or outbreaks in clinical and public health settings.


Conflict of interest statement

Competing Interests: The authors received a viral discovery award from Abbott Diagnostics, Inc. This does not alter the authors' adherence to all PLoS ONE policies on sharing data and materials.

Figures

Figure 1
Figure 1. 2009 H1N1 sample collection, processing, and analysis.
(A) Map of North America displaying originating locations for the 17 samples from laboratory-confirmed or suspected 2009 H1N1 cases analyzed in this study. The method for DNase treatment, found to greatly impact the deep sequencing results, is also shown. (B) Pipeline for metagenomic analysis of deep sequencing data. Filtered high-quality reads are classified by successive alignments to publicly available sequence databases.
Figure 2
Figure 2. Virochip microarray analysis of samples from patients with influenza-like illness.
(A) Cluster analysis and heat map profile for 29 nasopharyngeal swab samples analyzed using the Virochip. Samples (y-axis) and probes on the Virochip designed a priori and derived from 3 influenza A strains (x-axis) are clustered using hierarchical clustering. The red color saturation indicates the magnitude of normalized probe intensity. (B) For each sample, the average normalized probe intensity for Virochip probes corresponding to human H1N1 influenza A (light blue) or swine H1N1 influenza A (dark blue) is shown. The asterisks denote samples for which the difference in probe intensity is significant by t-test analysis (p<0.05). Abbreviations: HA, hemagglutinin; NP, nucleoprotein; Cal, California; HRV, human rhinovirus; HPIV1, human parainfluenza virus 1; HCoV, human coronavirus; HPIV3, human parainfluenza virus 3; RSV, respiratory syncytial virus; Neg, negative.
Figure 3
Figure 3. Metagenomic analysis of 2009 H1N1 samples by deep sequencing.
Pie charts depicting the number and distribution of sequence reads for each sample. Deep sequencing reads were successively aligned to human rRNA (dark green), human mitochondrial genomic DNA (medium green), other human genomic DNA/transcriptomic RNA (light green), and the non-redundant nucleotide (NT) database, containing bacterial (blue), viral (red), and “other” (black) sequences. Reads designated as “other” consisted solely of artificial plasmids or environmental sequences.
Figure 4
Figure 4. Deep sequencing analysis of bacteria in 2009 H1N1 samples.
All bacterial reads aligned to bacterial rRNA and are classified only at the genus level (family level for Enterobactericeae). (A) The pie charts depict the proportion of bacterial rRNA reads corresponding to the top-ranking (dark blue), second-ranking (medium blue), and third-ranking (light blue) bacterial families, as well as other remaining families (grey) and unidentified environmental samples (black). (B) For each sample, the identities of the top-ranking, second-ranking, and third-ranking bacterial family, as well as the majority genus within each family, are shown.
Figure 5
Figure 5. Relationship between percentage of deep sequencing reads aligning to 2009 H1N1 and viral titer.
(A) For each sample, the percentage of deep sequencing reads aligning to 2009 H1N1 is plotted as a function of the calculated viral titer (genome copy equivalents) per mL of nasal swab sample, and a linear regression line is fitted to the data. Samples are stratified by originating location and method of DNase treatment. (B) For each of the 17 samples, the calculated 2009 H1N1 viral titer (genome copy equivalents) per RT-PCR reaction (dark red) or per mL of nasal swab sample (pink) is shown.
Figure 6
Figure 6. Coverage map of the influenza genome for four 2009 H1N1 samples.
For each originating location, the sample that was found to have the best coverage is shown. The coverage is plotted on a log scale as a function of nucleotide position. For each segment, the coverage percentages at 1X and 3X are indicated.
Figure 7
Figure 7. Deep sequencing analysis of the human transcriptome in 2009 H1N1 samples.
Transcriptomic analysis was performed on the 12 samples that were treated with DNAse post-extraction. (A) Overexpressed genes in 2009 H1N1 samples relative to control samples were categorized using the PANTHER database . The six samples (out of 12) containing categories that are significantly overrepresented (p<0.05) are displayed. Categories related to immunity and host defense are highlighted in red. (B) Bar graph showing the total reads aligning to the transcriptome (green) and percentage coverage of the 2009 H1N1 genome by deep sequencing (red).
Figure 8
Figure 8. De novo assembly of the 2009 H1N1 genome.
(A) Algorithm for de novo assembly of the 2009 H1N1 genome assuming no a priori knowledge of the Orthomyxoviridae family and thus, no available reference genome. (B) Plot of number of contigs vs. contig length for de novo assembled contigs mapping to 2009 H1N1 influenza derived from all 17 pooled samples (dark red) or sample BC-1422 alone (pink), as well as for unaligned contigs (black). Note that the longest contigs all map to 2009 H1N1, even though influenza reads in all 17 pooled samples or BC-1422 comprise only 7.6% or 2.6% of the total reads, respectively. (C) Coverage of the 2009 H1N1 genome by de novo contig assembly from reads corresponding to all 17 pooled samples (top, dark red lines) or BC-1422 alone (bottom, pink lines).

Similar articles

Cited by

References

    1. Dawood FS, Jain S, Finelli L, Shaw MW, et al. Novel Swine-Origin Influenza AVIT. Emergence of a novel swine-origin influenza A (H1N1) virus in humans. N Engl J Med. 2009;360:2605–2615. - PubMed
    1. Shinde V, Bridges CB, Uyeki TM, Shu B, Balish A, et al. Triple-reassortant swine influenza A (H1) in humans in the United States, 2005-2009. N Engl J Med. 2009;360:2616–2625. - PubMed
    1. Fraser C, Donnelly CA, Cauchemez S, Hanage WP, Van Kerkhove MD, et al. Pandemic potential of a strain of influenza A (H1N1): early findings. Science. 2009;324:1557–1561. - PMC - PubMed
    1. Faix DJ, Sherman SS, Waterman SH. Rapid-test sensitivity for novel swine-origin influenza A (H1N1) virus in humans. N Engl J Med. 2009;361:728–729. - PubMed
    1. Smith GJ, Vijaykrishna D, Bahl J, Lycett SJ, Worobey M, et al. Origins and evolutionary genomics of the 2009 swine-origin H1N1 influenza A epidemic. Nature. 2009;459:1122–1125. - PubMed

Publication types

MeSH terms