. 2010 Oct 18;5(10):e13445.
doi: 10.1371/journal.pone.0013445.

The microRNA and messengerRNA profile of the RNA-induced silencing complex in human primary astrocyte and astrocytoma cells

Affiliations

The microRNA and messengerRNA profile of the RNA-induced silencing complex in human primary astrocyte and astrocytoma cells

Joanna J Moser et al. PLoS One. .

Abstract

Background: GW/P bodies are cytoplasmic ribonucleoprotein-rich foci involved in microRNA (miRNA)-mediated messenger RNA (mRNA) silencing and degradation. The mRNA regulatory functions within GW/P bodies are mediated by GW182 and its binding partner hAgo2 that bind miRNA in the RNA-induced silencing complex (RISC). To date there are no published reports of the profile of miRNA and mRNA targeted to the RISC or a comparison of the RISC-specific miRNA/mRNA profile differences in malignant and non-malignant cells.

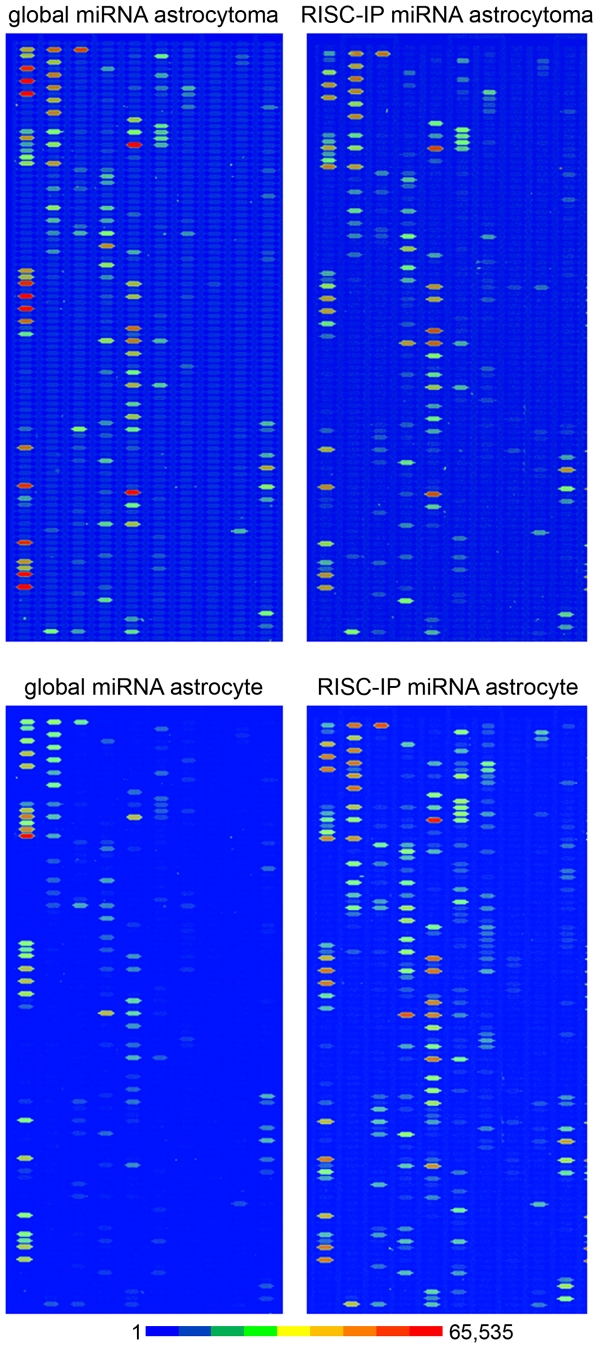
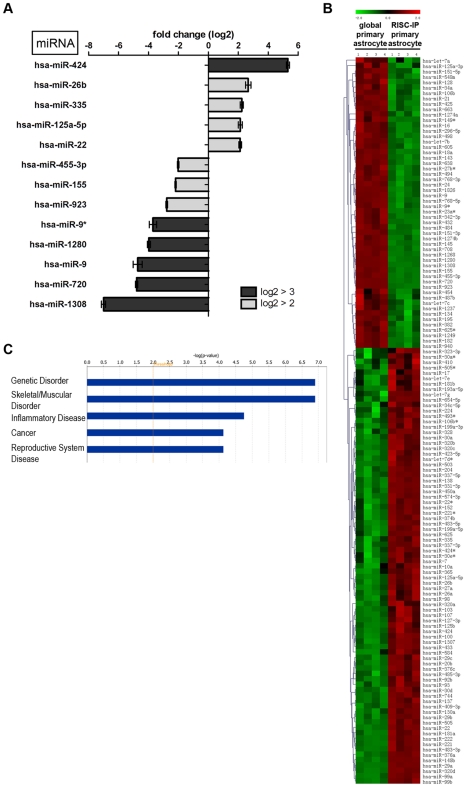
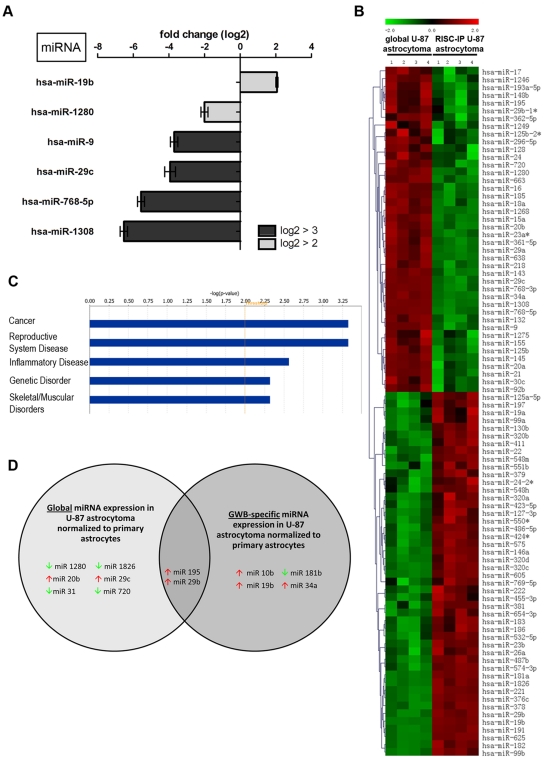
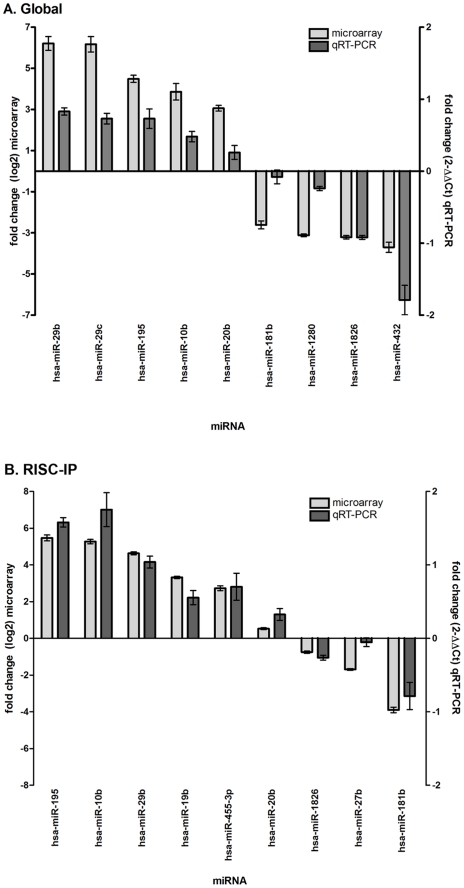
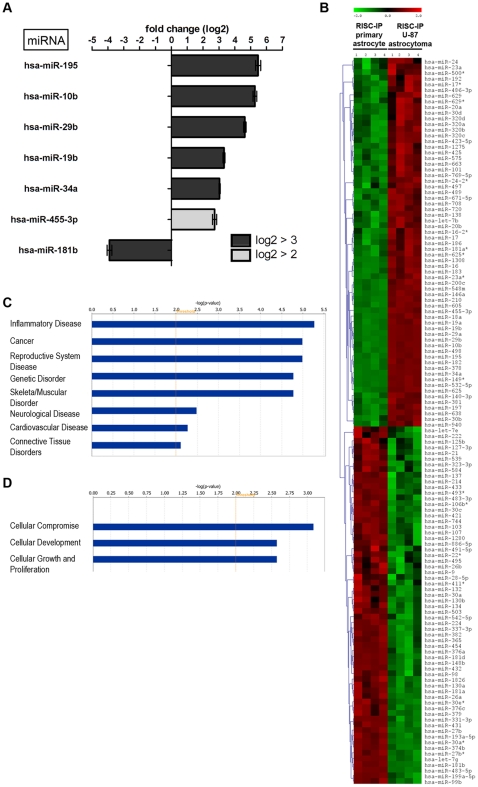
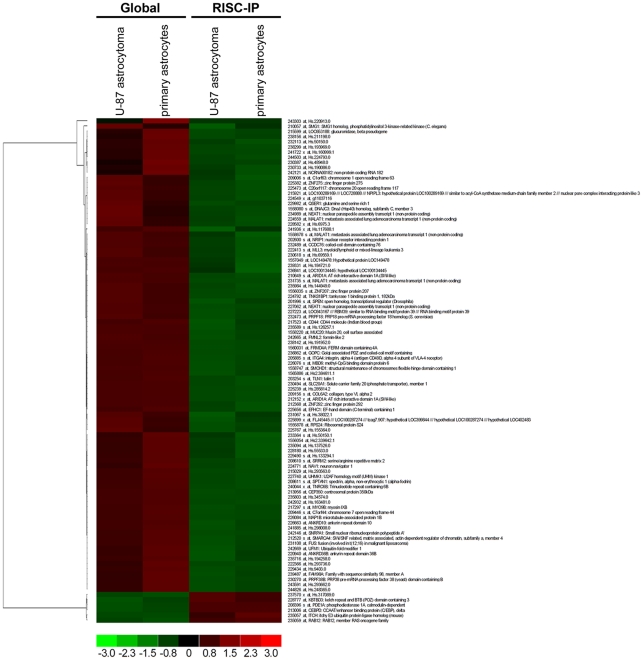
Methodology/principal findings: RISC mRNA and miRNA components were profiled by microarray analysis of malignant human U-87 astrocytoma cells and its non-malignant counterpart, primary human astrocytes. Total cell RNA as well as RNA from immunoprecipitated RISC was analyzed. The novel findings were fourfold: (1) miRNAs were highly enriched in astrocyte RISC compared to U-87 astrocytoma RISC, (2) astrocytoma and primary astrocyte cells each contained unique RISC miRNA profiles as compared to their respective cellular miRNA profiles, (3) miR-195, 10b, 29b, 19b, 34a and 455-3p levels were increased and the miR-181b level was decreased in U-87 astrocytoma RISC as compared to astrocyte RISC, and (4) the RISC contained decreased levels of mRNAs in primary astrocyte and U-87 astrocytoma cells.

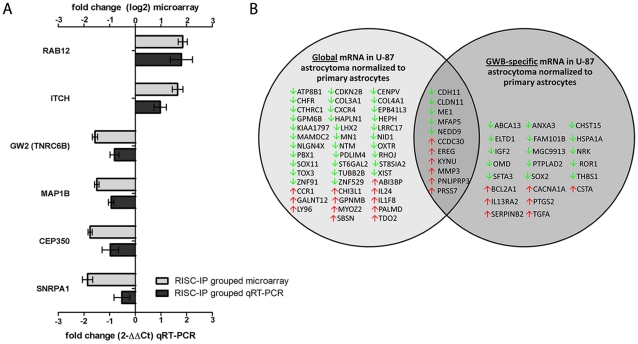
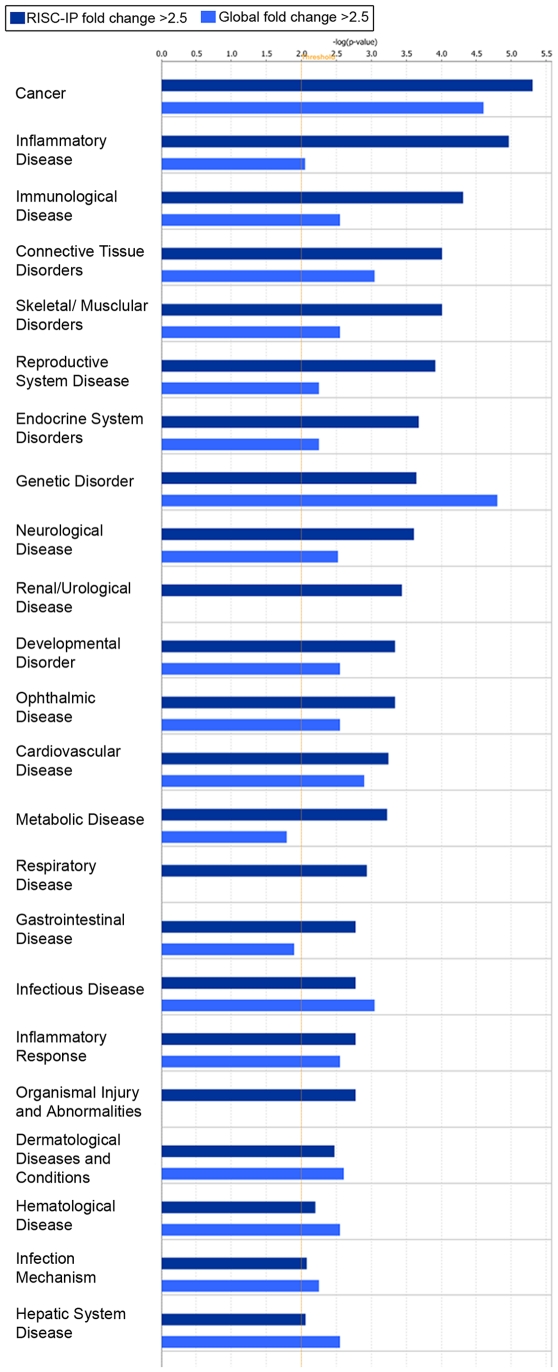
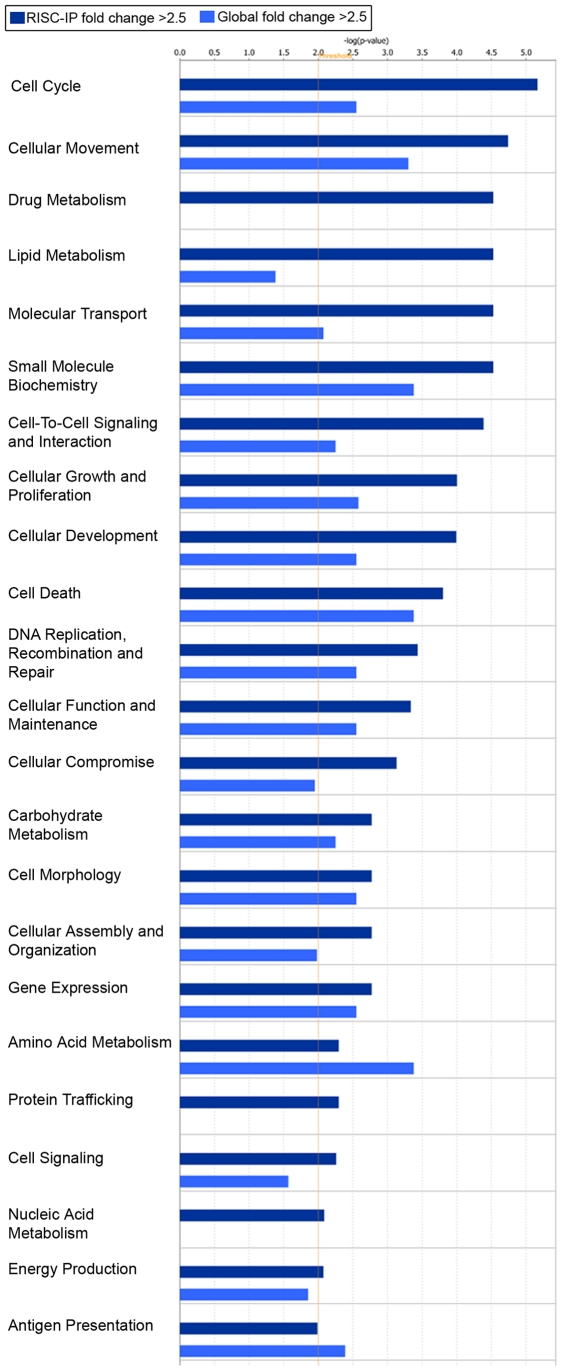
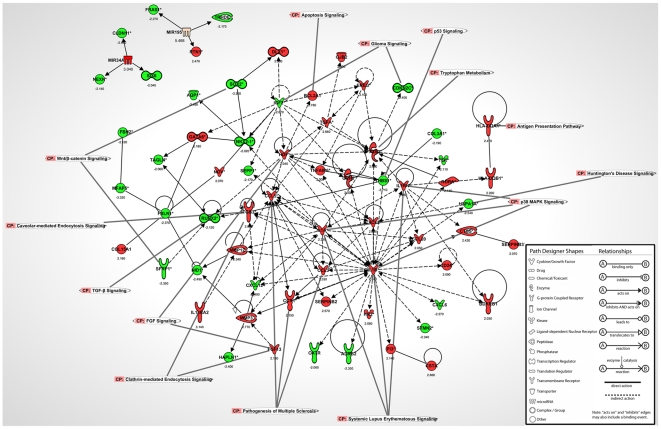
Conclusions/significance: The observation that miR-34a and miR-195 levels were increased in the RISC of U-87 astrocytoma cells suggests an oncogenic role for these miRNAs. Differential regulation of mRNAs by specific miRNAs is evidenced by the observation that three miR34a-targeted mRNAs and two miR-195-targeted mRNAs were downregulated while one miR-195-targeted mRNA was upregulated. Biological pathway analysis of RISC mRNA components suggests that the RISC plays a pivotal role in malignancy and other conditions. This study points to the importance of the RISC and ultimately GW/P body composition and function in miRNA and mRNA deregulation in astrocytoma cells and possibly in other malignancies.


Conflict of interest statement

Competing Interests: The authors have declared that no competing interests exist.

Figures

Figure 1
Figure 1. MiRNA microarray images of global and RISC-immunoprecipitated (RISC-IP) miRNA from human U-87 astrocytoma and primary human astrocyte cells.
The representative chip images are displayed in pseudo colors to expand the visual dynamic range. As signal intensity increases from 1 to 65,535, the corresponding color changes from blue to green, to yellow and to red.
Figure 2
Figure 2. RISC-IP miRNA expression compared to global miRNA expression in primary human astrocytes.
(A) MiRNAs with a log2 fold change >2 (p<0.01). MiRNAs with a positive fold change were increased in the RISC compared to the global cellular milieu in primary astrocytes and miRNAs with a negative fold change are decreased in RISC compared to the global cellular milieu in primary astrocytes. (B) Hierarchical cluster heatmap showing all significantly expressed miRNAs (p<0.01) in four independent samples/cell types. Each row shows the relative expression level for a single miRNA and each column shows the expression level for a single sample. The red or green color indicates relative high or low expression, respectively. (C) Disease/disorders associated with the miRNAs differentially expressed in RISC compared to the global cellular milieu of primary astrocytes with a Fisher's exact test p-value threshold set at 0.01 (yellow threshold line) using Ingenuity Pathway Analysis software.
Figure 3
Figure 3. RISC-IP miRNA expression compared to global miRNA expression in human U-87 astrocytoma cells.
(A) MiRNAs with a log2 fold change >2 (p<0.01). MiRNAs with a positive fold change are increased in RISC compared to the global cellular milieu in astrocytoma cells and miRNAs with a negative fold change are decreased in RISC compared to the global cellular milieu in astrocytoma cells. (B) Hierarchical cluster heatmap showing all significantly expressed miRNAs (p<0.01) in four independent samples/cell type. Each row shows the relative expression level for a single miRNA and each column shows the expression level for a single sample. The red or green color indicates relative high or low expression, respectively. (C) Disease/disorders associated with the miRNAs differentially expressed in RISC compared to the global cellular milieu of U-87 astrocytoma cells with a Fisher's exact test p-value threshold set at 0.01 (yellow threshold line) using IPA software. (D) MiRNAs in RISC compared to the global cellular fraction in U-87 astrocytoma cells. U-87 astrocytoma cell miRNA expression was normalized to primary astrocytes miRNA expression. MiRNAs displayed have a log2 fold change >3. Green and red arrows indicate decreased and increased miRNA levels respectively.
Figure 4
Figure 4. MiRNA microarray validation with qRT-PCR analysis for (A) global miRNA and (B) RISC-specific miRNA.
Nine random miRNAs were selected from the miRNA microarray datasets and examined by qRT-PCR. Fold change from the miRNA microarray are given by log2 values (left y-axis, light grey bars). Fold change from the qRT-PCR was determined using the 2-ΔΔCt method and all miRNA expression values were normalized to the RNU6B endogenous control (right y-axis, dark grey bars). Error bars represent the standard deviation of the mean (SD). Note: only the general trend of up-regulation and down-regulation can be compared but the fold change (y-axis) cannot be directly compared between assays due to differences in calculation methods.
Figure 5
Figure 5. RISC-IP miRNA expression in human U-87 astrocytoma cells compared to primary human astrocytes.
(A) MiRNAs with a log2 fold change >2 (p<0.01). MiRNAs with a positive fold change are increased in RISC-IP astrocytoma cells compared to RISC-IP astrocytes and miRNAs with a negative fold change are decreased in RISC-IP astrocytoma cells compared to RISC-IP astrocytes. (B) Hierarchical cluster heatmap showing all significantly expressed miRNAs (p<0.01) in four independent samples/cell type. Each row shows the relative expression level for a single miRNA and each column shows the expression level for a single sample. The red or green color indicates relative high or low expression, respectively. (C) Disease/disorders and (D) molecular and cellular functions associated with the miRNAs differentially expressed in RISC of U-87 astrocytoma cells compared to primary astrocytes with a Fisher's exact test p-value threshold set at 0.01 (yellow threshold line) using IPA software.
Figure 6
Figure 6. Global mRNA levels to RISC-IP mRNA levels in U-87 astrocytoma and primary astrocytes.
A hierarchical heatmap comparing global mRNA levels to RISC-IP mRNA levels in U-87 astrocytoma and primary astrocytes. MRNAs included in the heatmap had a fold change >1.4 and were significantly expressed (p<0.01).
Figure 7
Figure 7
(A) MRNA microarray validation with qRT-PCR analysis in grouped RISC-IP U-87 astrocytoma and primary astrocytes samples. Grouped RISC-IP data were compared to the grouped global mRNA from U-87 astrocytoma and primary astrocytes samples. Eight mRNAs were selected from the grouped mRNA microarray dataset and examined by qRT-PCR. Fold change from the mRNA microarray are given by log2 values (left y-axis, light grey bars). Fold change from the qRT-PCR was determined using the 2-ΔΔCt method and all mRNA expression values were normalized to the beta-actin endogenous control (right y-axis, dark grey bars). Error bars represent the standard deviation of the mean (SD). Importantly, the fold change (y-axis) cannot be directly compared between assays due to differences in calculation methods, but the general trend of up-regulation and down-regulation can be compared. (B) MRNAs in RISC compared to the global cellular milieu in U-87 astrocytoma cells. MRNA expression in U-87 astrocytoma cells were normalized to primary astrocytes mRNA expression. All mRNAs had a fold change >2.5 and were significantly expressed (p<0.01). Green and red arrows indicate decreased and increased levels respectively.
Figure 8
Figure 8. Disease and disorder representation of the mRNA in the RISC of U-87 astrocytoma cells compared to primary astrocytes and the mRNA in the global cellular milieu of U-87 astrocytoma cells compared to primary astrocytes.
Bar charts display the relative number (-log(p-value)) of mRNAs with a fold change >2.5 and were considered significant (p<0.01). RISC-IP mRNA were indicated with dark blue bars and the global mRNA were indicated with light blue bars. The threshold (yellow lines) were set at p<0.01 and were calculated using Fischer's exact p-value test using IPA software.
Figure 9
Figure 9. Molecular and cellular functional assessment of the mRNA in the RISC of U-87 astrocytoma cells compared to primary astrocytes and the mRNA in the global cellular milieu of U-87 astrocytoma cells compared to primary astrocytes.
Bar charts display the relative number (-log(p-value)) of mRNAs with a fold change >2.5 and were considered significant (p<0.01). RISC-IP mRNA were indicated with dark blue bars and the global mRNA were indicated with light blue bars. The threshold (yellow lines) were set at p<0.01 and were calculated using Fischer's exact p-value test using IPA software.
Figure 10
Figure 10. Biological pathway analysis showing the links between miRNA and mRNAs IP from RISC of U-87 astrocytoma cells compared to primary astrocytes using IPA software.
All miRNA and mRNA were significantly expressed (p<0.01). MiRNA had a log2 fold change >3 and mRNA had a log2 fold change >2. Some key canonical pathways are indicated by labels.

Similar articles

Cited by

References

    1. Eystathioy T, Chan EKL, Tenenbaum SA, Keene JD, Griffith KJ, et al. A phosphorylated cytoplasmic autoantigen, GW182, associates with a unique population of human mRNAs within novel cytoplasmic speckles. Mol Biol Cell. 2002;13:1338–1351. - PMC - PubMed
    1. Mello CC, Conte D., Jr Revealing the world of RNA interference. Nature. 2004;431:338–342. - PubMed
    1. Meister G, Tuschl T. Mechanisms of gene silencing by double-stranded RNA. Nature. 2004;431:343–349. - PubMed
    1. Jakymiw A, Pauley KM, Li S, Ikeda K, Lian S, et al. The role of GW/P bodies in RNA processing and silencing. J Cell Sci. 2007;120:1317–1323. - PubMed
    1. Eulalio A, Behm-Ansmant I, Izaurralde E. P bodies: at the crossroads of post-transcriptional pathways. Nat Rev Mol Cell Biol. 2007;8:9–22. - PubMed

Publication types