. 2010 Oct 18;5(10):e13463.
doi: 10.1371/journal.pone.0013463.

Hyperglycemia induces oxidative stress and impairs axonal transport rates in mice

Affiliations

Hyperglycemia induces oxidative stress and impairs axonal transport rates in mice

Ruchi Sharma et al. PLoS One. .

Abstract

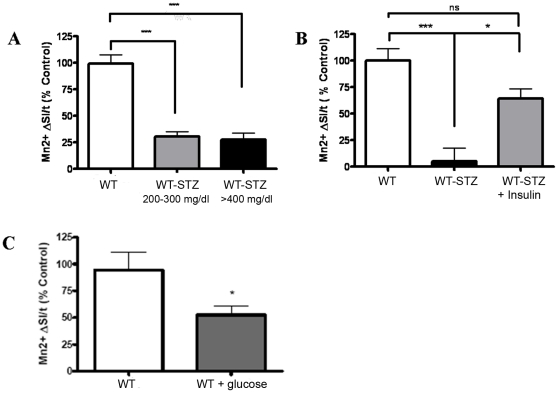
Background: While hyperglycemia-induced oxidative stress damages peripheral neurons, technical limitations have, in part, prevented in vivo studies to determine the effect of hyperglycemia on the neurons in the central nervous system (CNS). While olfactory dysfunction is indicated in diabetes, the effect of hyperglycemia on olfactory receptor neurons (ORNs) remains unknown. In this study, we utilized manganese enhanced MRI (MEMRI) to assess the impact of hyperglycemia on axonal transport rates in ORNs. We hypothesize that (i) hyperglycemia induces oxidative stress and is associated with reduced axonal transport rates in the ORNs and (ii) hyperglycemia-induced oxidative stress activates the p38 MAPK pathway in association with phosphorylation of tau protein leading to the axonal transport deficits.

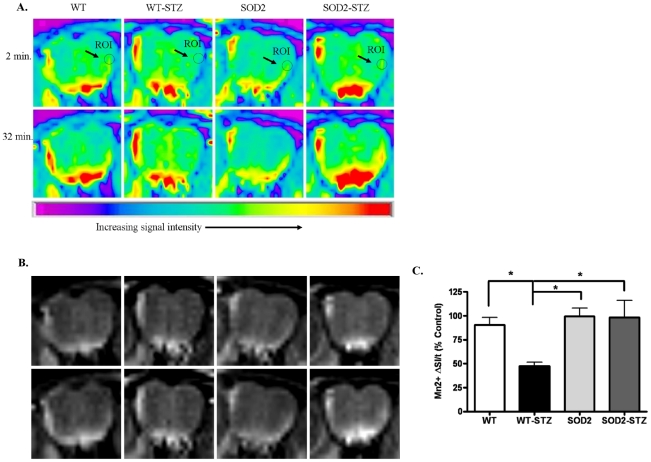
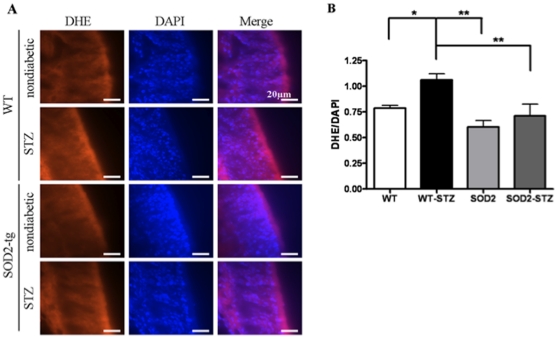
Research design and methods: T(1)-weighted MEMRI imaging was used to determine axonal transport rates post-streptozotocin injection in wildtype (WT) and superoxide dismutase 2 (SOD2) overexpressing C57Bl/6 mice. SOD2 overexpression reduces mitochondrial superoxide load. Dihydroethidium staining was used to quantify the reactive oxygen species (ROS), specifically, superoxide (SO). Protein and gene expression levels were determined using western blotting and Q-PCR analysis, respectively.

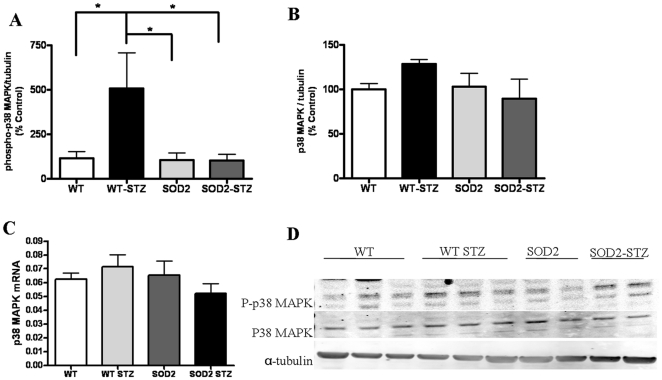
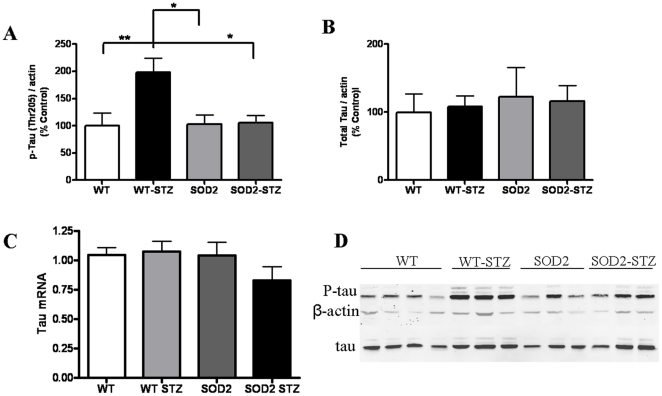
Results: STZ-treated WT mice exhibited significantly reduced axonal transport rates and significantly higher levels of ROS, phosphorylated p38 MAPK and tau protein as compared to the WT vehicle treated controls and STZ-treated SOD2 mice. The gene expression levels of p38 MAPK and tau remained unchanged.

Conclusion: Increased oxidative stress in STZ-treated WT hyperglycemic mice activates the p38 MAPK pathway in association with phosphorylation of tau and attenuates axonal transport rates in the olfactory system. In STZ-treated SOD-overexpressing hyperglycemic mice in which superoxide levels are reduced, these deficits are reversed.


Conflict of interest statement

Competing Interests: The authors have declared that no competing interests exist.

Figures

Figure 1
Figure 1. STZ-induced hyperglycemia impairs axonal transport in the olfactory receptor neurons.
(A) Graph depicts axonal transport rates (depicted as Mn2+ ΔSI/t on Y axis, where “SI” is signal intensity and “t” is time) of Mn2+at 1 week post-STZ treatment for WT(n = 3) and WT-STZ with fasting glucose levels 200–399 mg/dl (n = 3), and >400 mg/dl (n = 5). (B) Graph depicts the changes in axonal transport rates for WT (n = 4), WT-STZ (n = 3), and WT-STZ+insulin treated mice (n = 4). (C) The graph represents changes in axonal transport rates in a mouse model of WT-STZ (n = 5) as compared to WT mice (n = 4). Statistical analysis: One way ANOVA, Tukey's post test for more than 2 groups and Students t test to compare 2 groups. * p<0.05, ** p<0.01, *** p<0.001/WT  =  wildtype control. WT-STZ  =  Wildtype treated with streptozotocin.
Figure 2
Figure 2. MEMRI experiments demonstrate that the axonal transport deficits in WT-STZ mice recover in SOD2-STZ mice.
(A) Pseudo-color MRI images depicting changes in Mn2+ signal intensities (yellow color) at the beginning (2minutes) and at the end of the imaging session (32 minutes) at a region of interest (ROI) identified as a circle on the outer olfactory neuronal layer (ONL). Note that the WT, SOD and SOD2-STZ mice exhibit a change from green (2 minute time point) to yellow (32 minute time point) whereas the WT-STZ animals exhibit a light green color at both time points indicating that Mn2+ has not traveled to these areas at the same rate. (B) Gray-Scale Image of the same data set in (A). (C) The graph depicts normalized axonal transport rates (% control) in the WT and SOD2 mice treated with vehicle or STZ for a week before in vivo axonal transport studies. Twelve mice were used in the WT group and four mice were used in each of WT-STZ, SOD2, and SOD2-STZ groups. Statistical analysis: One way ANOVA, Dunnett's post-test. * p<0.05. SOD2  =  SOD-2 overexpressing mice; SOD2-STZ  =  SOD-2 overexpressing mice treated with STZ.
Figure 3
Figure 3. STZ- WT mice depict significantly increased ROS levels that decrease in]SOD2-STZ mice.
(A) The images depict nasal cavity sections showing genotypic differences in DHE fluorescence. (B) The graph depicts ratio of DHE and corresponding DAPI fluorescence, which was measured with ImageJ software. Significance was assessed by one way ANOVA with Dunnett's post-test. For WT, WT-STZ, SOD2, and SOD2-STZ n = 4, 6, 4, 4 respectively. ** p<0.01, * p<0.05 Bar = 20 µm.
Figure 4
Figure 4. Phosphorylated p38 MAPK significantly increase in WT-STZ mice and recovers in SOD2-STZ mice.
Western blotting analysis of OB tissues from WT, WT-STZ, SOD2, SOD2-STZ mice show: (A) changes in phosphorylated p38 MAPK levels (for WT n = 7 and for WT-STZ, SOD2, and SOD2-STZ n = 5), (B) changes in total p38 MAPK protein levels, (for WT and WT-STZ n = 7, for SOD2 n = 6, and for SOD2-STZ n = 5) (C) QPCR experiment using brain homogenates depict relative changes in mRNA levels of p38 MAPK, six mice in each group and (D) representative western blot from OBs homogenates from 1 week vehicle or STZ treated 2-4-month-old mice. The results are normalized to α-tubulin. Statistical analysis: One way ANOVA followed by Dunnett's post test. ** p<0.01, *p<0.05.
Figure 5
Figure 5. Phosphorylated Tau significantly increase in WT-STZ mice and recovers in SOD2-STZ mice, despite hyperglycemia.
Western blotting analysis of OB tissues from WT, WT-STZ, SOD2, SOD2-STZ mice show: (A) changes in site-specific phosphorylation of tau (p-tau) at threonine 205, (seven mice in WT, WT-STZ groups and six in SOD2 and SOD2-STZ groups) (B) changes in total levels of tau protein, (seven mice in WT, WT-STZ groups and six in SOD2 and SOD2-STZ groups) (C) QPCR of brain homogenates depict relative changes in mRNA levels of tau, (six mice used in each of the four groups) and (D) representative western blot from OB homogenates from 1 week vehicle or STZ treated 2-4-month-old mice. The results are normalized to β-actin. Statistical analysis: One way ANOVA followed by Dunnett's post test. ** p<0.01, *p<0.05.

References

    1. Menne J, Park J-K, Boehne M, Elger M, Lindschau C, et al. Diminished loss of proteoglycans and lack of albuminuria in protein kinase C-alpha-deficient diabetic mice. Diabetes. 2004;53:2101–2109. - PubMed
    1. Vincent AM, Kato K, McLean LL, Soules ME, Feldman EL. Sensory neurons and schwann cells respond to oxidative stress by increasing antioxidant defense mechanisms. Antioxid Redox Signal. 2009;11:425–438. - PMC - PubMed
    1. Dennis JC, Coleman ES, Swyers SE, Moody SW, Wright JC, et al. Changes in mitotic rate and GFAP expression in the primary olfactory axis of streptozotocin-induced diabetic rats. J Neurocytol. 2005;34:3–10. - PubMed
    1. Le Floch JP, Le Lievre G, Labroue M, Paul M, Peynegre R, et al. Smell dysfunction and related factors in diabetes. Diabetes Care. 1993;16:934–937. - PubMed
    1. Weinstock RS, Wright HN, Smith DU. Olfactory dysfunction in diabetes mellitus. Physiol Behav. 1993;53:17–21. - PubMed

Publication types