Increasing costs due to ocean acidification drives phytoplankton to be more heavily calcified: optimal growth strategy of coccolithophores
- PMID: 20976167
- PMCID: PMC2955539
- DOI: 10.1371/journal.pone.0013436
Increasing costs due to ocean acidification drives phytoplankton to be more heavily calcified: optimal growth strategy of coccolithophores
Abstract
Ocean acidification is potentially one of the greatest threats to marine ecosystems and global carbon cycling. Amongst calcifying organisms, coccolithophores have received special attention because their calcite precipitation plays a significant role in alkalinity flux to the deep ocean (i.e., inorganic carbon pump). Currently, empirical effort is devoted to evaluating the plastic responses to acidification, but evolutionary considerations are missing from this approach. We thus constructed an optimality model to evaluate the evolutionary response of coccolithophorid life history, assuming that their exoskeleton (coccolith) serves to reduce the instantaneous mortality rates. Our model predicted that natural selection favors constructing more heavily calcified exoskeleton in response to increased acidification-driven costs. This counter-intuitive response occurs because the fitness benefit of choosing a better-defended, slower growth strategy in more acidic conditions, outweighs that of accelerating the cell cycle, as this occurs by producing less calcified exoskeleton. Contrary to the widely held belief, the evolutionarily optimized population can precipitate larger amounts of CaCO(3) during the bloom in more acidified seawater, depending on parameter values. These findings suggest that ocean acidification may enhance the calcification rates of marine organisms as an adaptive response, possibly accompanied by higher carbon fixation ability. Our theory also provides a compelling explanation for the multispecific fossil time-series record from ∼200 years ago to present, in which mean coccolith size has increased along with rising atmospheric CO(2) concentration.
Conflict of interest statement
Figures


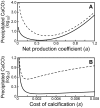
 at different q-values (i.e., 1−k≤q≤2(1−k)). Parameter values: a = 1.0, s = 1.0, α = 0.0001, P = 0.2, k = β = 2/3.

References
-
- Caldeira K, Wickett ME. Anthropogenic carbon and ocean pH. Nature. 2003;425:365. - PubMed
-
- Orr JC, Fabry VJ, Aumont O, Bopp L, Doney SC, et al. Anthropogenic ocean acidification over the twenty-first century and its impact on calcifying organisms. Nature. 2005;437:681–686. - PubMed
-
- Royal Society. Ocean acidification due to increasing atmospheric carbon dioxide (Policy Document 12/05, Royal Society, London) 2005. 60
-
- Kleypas JA, Feely RA, Fabry VJ, Langdon C, Sabine CL, et al. Impacts of ocean acidification on coral reefs and other marine calcifiers: a guide for future research. 2006. 88 Report of a workshop sponsored by NSF, NOAA, and the U.S. Geological Survey. St. Petersburg, Florida.
-
- Przeslawski R, Ahyong S, Byrne M, Worheide G, Hutchings P. Beyond corals and fish: the effects of climate change on noncoral benthic invertebrates of tropical reefs. Glob Change Biol. 2008;14:2773–2795.
Publication types
MeSH terms
Substances
LinkOut - more resources
Full Text Sources

