

CoAIMs: a cost-effective panel of ancestry informative markers for determining continental origins
- PMID: 20976178
- PMCID: PMC2955551
- DOI: 10.1371/journal.pone.0013443
CoAIMs: a cost-effective panel of ancestry informative markers for determining continental origins
Abstract
Background: Genetic ancestry is known to impact outcomes of genotype-phenotype studies that are designed to identify risk for common diseases in human populations. Failure to control for population stratification due to genetic ancestry can significantly confound results of disease association studies. Moreover, ancestry is a critical factor in assessing lifetime risk of disease, and can play an important role in optimizing treatment. As modern medicine moves towards using personal genetic information for clinical applications, it is important to determine genetic ancestry in an accurate, cost-effective and efficient manner. Self-identified race is a common method used to track and control for population stratification; however, social constructs of race are not necessarily informative for genetic applications. The use of ancestry informative markers (AIMs) is a more accurate method for determining genetic ancestry for the purposes of population stratification.
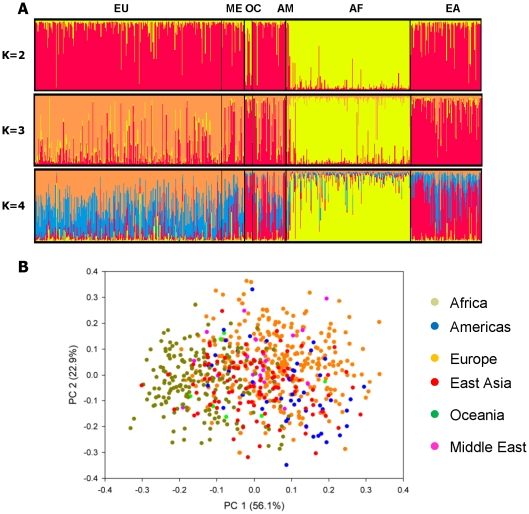
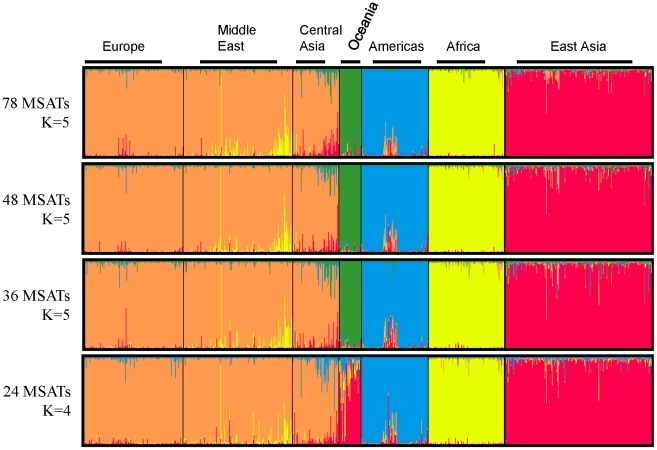
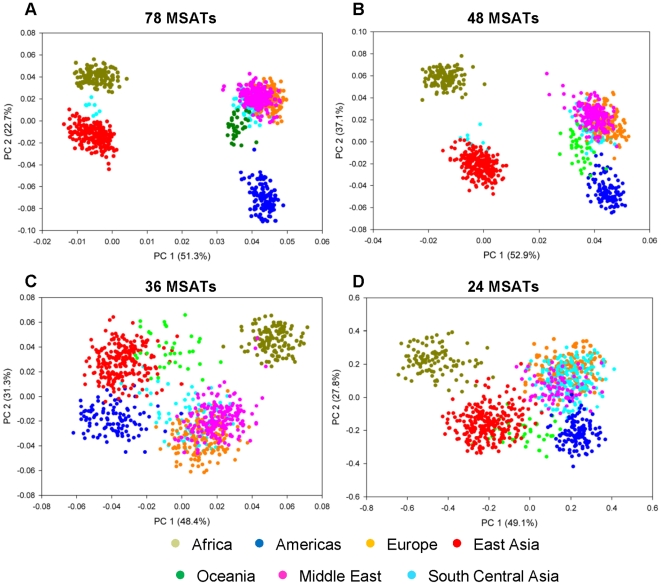
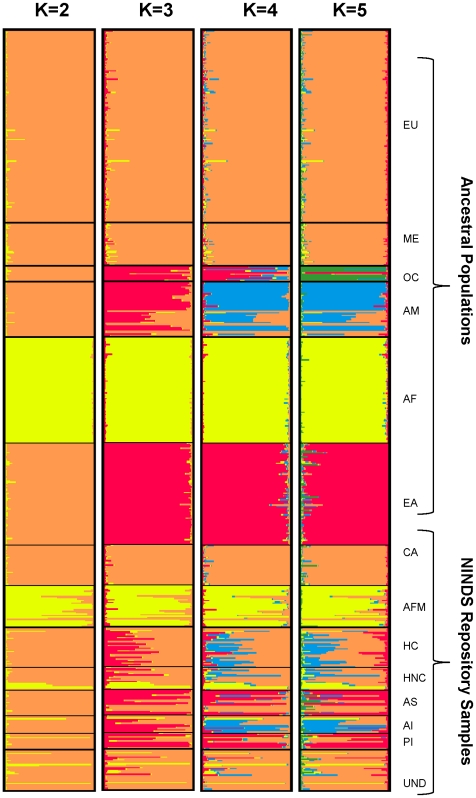
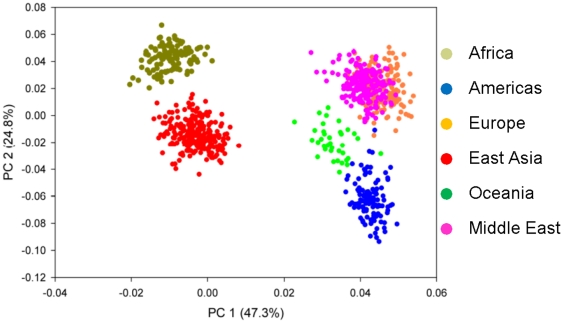
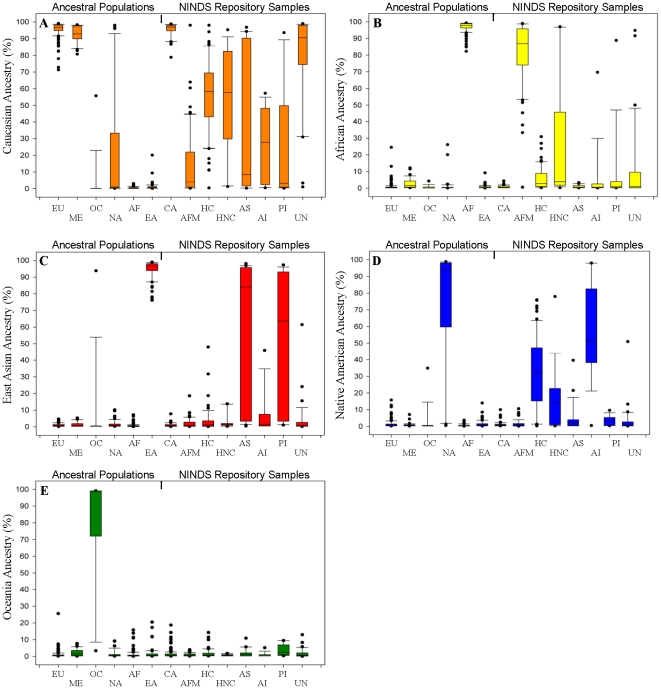
Methodology/principal findings: Here we introduce a novel panel of 36 microsatellite (MSAT) AIMs that determines continental admixture proportions. This panel, which we have named Continental Ancestry Informative Markers or CoAIMs, consists of MSAT AIMs that were chosen based upon their measure of genetic variance (F(st)), allele frequencies and their suitability for efficient genotyping. Genotype analysis using CoAIMs along with a Bayesian clustering method (STRUCTURE) is able to discern continental origins including Europe/Middle East (Caucasians), East Asia, Africa, Native America, and Oceania. In addition to determining continental ancestry for individuals without significant admixture, we applied CoAIMs to ascertain admixture proportions of individuals of self declared race.
Conclusion/significance: CoAIMs can be used to efficiently and effectively determine continental admixture proportions in a sample set. The CoAIMs panel is a valuable resource for genetic researchers performing case-control genetic association studies, as it can control for the confounding effects of population stratification. The MSAT-based approach used here has potential for broad applicability as a cost effective tool toward determining admixture proportions.
Conflict of interest statement
Figures
Similar articles
-
An ancestry informative marker panel design for individual ancestry estimation of Hispanic population using whole exome sequencing data.BMC Genomics. 2019 Dec 30;20(Suppl 12):1007. doi: 10.1186/s12864-019-6333-6. BMC Genomics. 2019. PMID: 31888480 Free PMC article.
-
Inference of human continental origin and admixture proportions using a highly discriminative ancestry informative 41-SNP panel.Investig Genet. 2013 Jul 1;4(1):13. doi: 10.1186/2041-2223-4-13. Investig Genet. 2013. PMID: 23815888 Free PMC article.
-
Embryonic aneuploidy does not differ among genetic ancestry according to continental origin as determined by ancestry informative markers.Hum Reprod. 2016 Oct;31(10):2391-5. doi: 10.1093/humrep/dew195. Epub 2016 Sep 2. Hum Reprod. 2016. PMID: 27591228
-
Genetic admixture and obesity: recent perspectives and future applications.Hum Hered. 2013;75(2-4):98-105. doi: 10.1159/000353180. Epub 2013 Sep 27. Hum Hered. 2013. PMID: 24081225 Free PMC article. Review.
-
Global and Local Ancestry and its Importance: A Review.Curr Genomics. 2024;25(4):237-260. doi: 10.2174/0113892029298909240426094055. Epub 2024 May 9. Curr Genomics. 2024. PMID: 39156729 Free PMC article. Review.
Cited by
-
Education, genetic ancestry, and blood pressure in African Americans and Whites.Am J Public Health. 2012 Aug;102(8):1559-65. doi: 10.2105/AJPH.2011.300448. Epub 2012 Jun 14. Am J Public Health. 2012. PMID: 22698014 Free PMC article.
-
The three-hybrid genetic composition of an Ecuadorian population using AIMs-InDels compared with autosomes, mitochondrial DNA and Y chromosome data.Sci Rep. 2019 Jun 25;9(1):9247. doi: 10.1038/s41598-019-45723-w. Sci Rep. 2019. PMID: 31239502 Free PMC article.
-
Atopic dermatitis increases the effect of exposure to peanut antigen in dust on peanut sensitization and likely peanut allergy.J Allergy Clin Immunol. 2015 Jan;135(1):164-70. doi: 10.1016/j.jaci.2014.10.007. Epub 2014 Nov 18. J Allergy Clin Immunol. 2015. PMID: 25457149 Free PMC article.
-
An overview of STRUCTURE: applications, parameter settings, and supporting software.Front Genet. 2013 May 29;4:98. doi: 10.3389/fgene.2013.00098. eCollection 2013. Front Genet. 2013. PMID: 23755071 Free PMC article.
-
Integrative analysis of single nucleotide polymorphisms and gene expression efficiently distinguishes samples from closely related ethnic populations.BMC Genomics. 2012 Jul 28;13:346. doi: 10.1186/1471-2164-13-346. BMC Genomics. 2012. PMID: 22839760 Free PMC article.
References
-
- Campbell CD, Ogburn EL, Lunetta KL, Lyon HN, Freedman ML, et al. Demonstrating stratification in a European American population. Nat Genet. 2005;37:868–872. - PubMed
-
- Freedman ML, Reich D, Penney KL, McDonald GJ, Mignault AA, et al. Assessing the impact of population stratification on genetic association studies. Nat Genet. 2004;36:388–393. - PubMed
-
- Lander ES, Schork NJ. Genetic dissection of complex traits. Science. 1994;265:2037–2048. - PubMed
-
- Hindforff LA, Junkins HA, Mehta JP, Manolio TA. A Catalog of Published Genome Wide Association Studies. 2009. Available at: www.genome.gov/26525384.
-
- Barnholtz-Sloan JS, Chakraborty R, Sellers TA, Schwartz AG. Examining population stratification via individual ancestry estimates versus self-reported race. Cancer Epidemiol Biomarkers Prev. 2005;14:1545–1551. - PubMed
Publication types
MeSH terms
LinkOut - more resources
Full Text Sources
Research Materials
Miscellaneous
