

Deconvoluting post-transplant immunity: cell subset-specific mapping reveals pathways for activation and expansion of memory T, monocytes and B cells
- PMID: 20976225
- PMCID: PMC2954794
- DOI: 10.1371/journal.pone.0013358
Deconvoluting post-transplant immunity: cell subset-specific mapping reveals pathways for activation and expansion of memory T, monocytes and B cells
Abstract
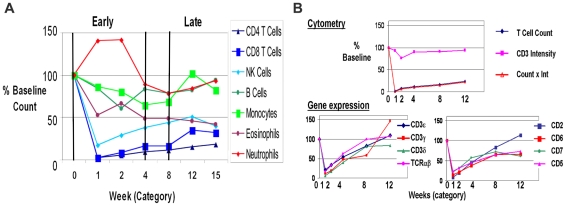
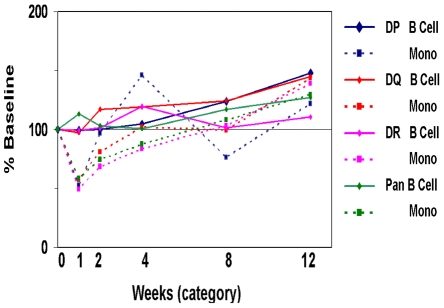
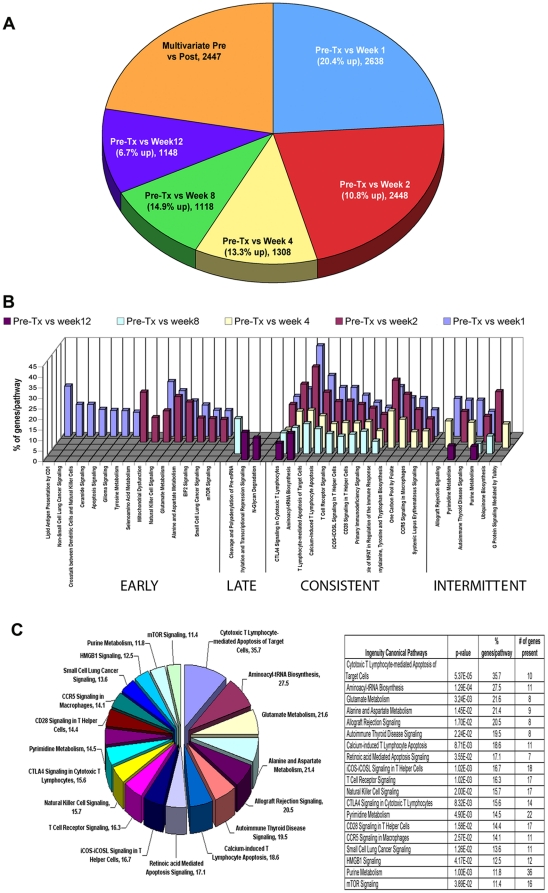
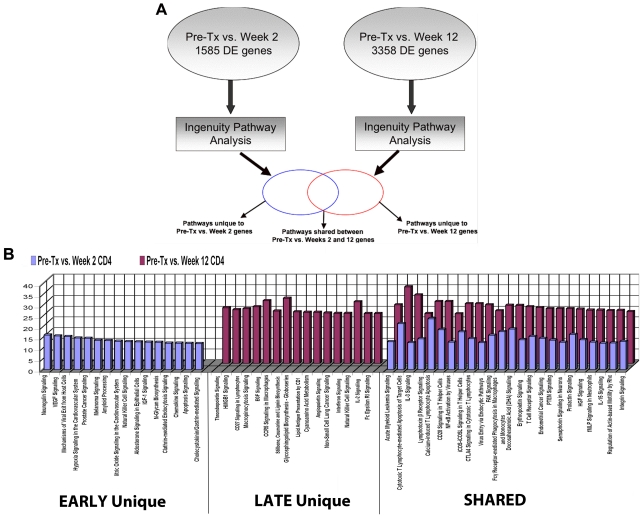
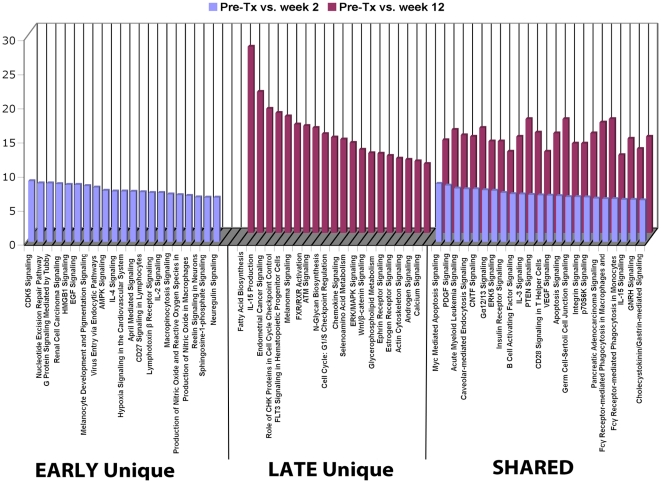
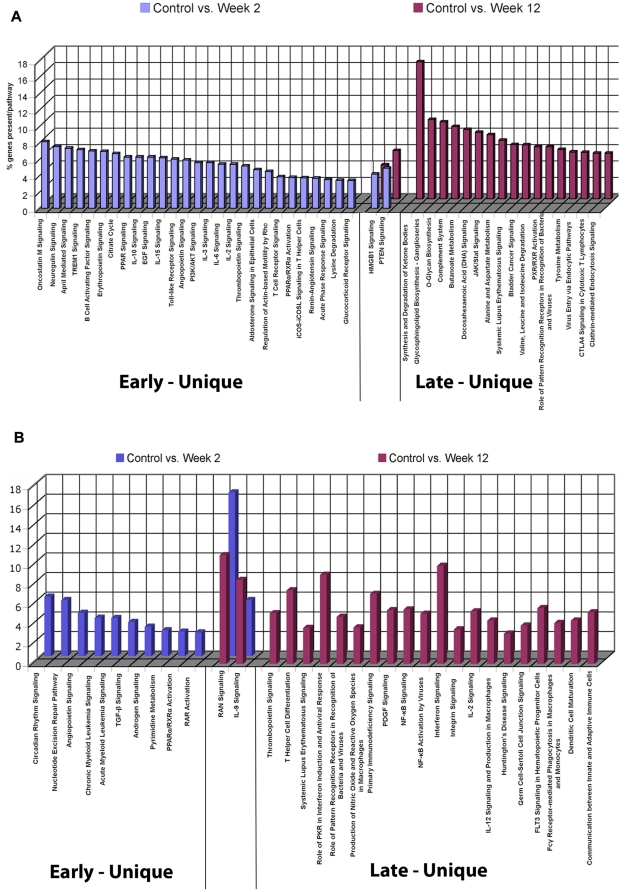
A major challenge for the field of transplantation is the lack of understanding of genomic and molecular drivers of early post-transplant immunity. The early immune response creates a complex milieu that determines the course of ensuing immune events and the ultimate outcome of the transplant. The objective of the current study was to mechanistically deconvolute the early immune response by purifying and profiling the constituent cell subsets of the peripheral blood. We employed genome-wide profiling of whole blood and purified CD4, CD8, B cells and monocytes in tandem with high-throughput laser-scanning cytometry in 10 kidney transplants sampled serially pre-transplant, 1, 2, 4, 8 and 12 weeks. Cytometry confirmed early cell subset depletion by antibody induction and immunosuppression. Multiple markers revealed the activation and proliferative expansion of CD45RO(+)CD62L(-) effector memory CD4/CD8 T cells as well as progressive activation of monocytes and B cells. Next, we mechanistically deconvoluted early post-transplant immunity by serial monitoring of whole blood using DNA microarrays. Parallel analysis of cell subset-specific gene expression revealed a unique spectrum of time-dependent changes and functional pathways. Gene expression profiling results were validated with 157 different probesets matching all 65 antigens detected by cytometry. Thus, serial blood cell monitoring reflects the profound changes in blood cell composition and immune activation early post-transplant. Each cell subset reveals distinct pathways and functional programs. These changes illuminate a complex, early phase of immunity and inflammation that includes activation and proliferative expansion of the memory effector and regulatory cells that may determine the phenotype and outcome of the kidney transplant.
Conflict of interest statement
Figures
Similar articles
-
Systemic varicella zoster virus reactive effector memory T-cells impaired in the elderly and in kidney transplant recipients.J Med Virol. 2012 Dec;84(12):2018-25. doi: 10.1002/jmv.23427. J Med Virol. 2012. PMID: 23080511
-
Longitudinal analysis of T and B cell phenotype and function in renal transplant recipients with or without rituximab induction therapy.PLoS One. 2014 Nov 13;9(11):e112658. doi: 10.1371/journal.pone.0112658. eCollection 2014. PLoS One. 2014. PMID: 25393622 Free PMC article. Clinical Trial.
-
Kidney transplant recipients show an increase in the ratio of T-cell effector memory/central memory as compared to nontransplant recipients on the waiting list.Transplant Proc. 2010 Oct;42(8):2877-9. doi: 10.1016/j.transproceed.2010.07.072. Transplant Proc. 2010. PMID: 20970557
-
Single-Cell Profiling of Kidney Transplant Recipients With Immunosuppressive Treatment Reveals the Dynamic Immune Characteristics.Front Immunol. 2021 Apr 20;12:639942. doi: 10.3389/fimmu.2021.639942. eCollection 2021. Front Immunol. 2021. PMID: 33959124 Free PMC article.
-
Alterations in levels of CD28-/CD8+ suppressor cell precursor and CD45RO+/CD4+ memory T lymphocytes in the peripheral blood of multiple sclerosis patients.Clin Diagn Lab Immunol. 1995 Mar;2(2):249-52. doi: 10.1128/cdli.2.2.249-252.1995. Clin Diagn Lab Immunol. 1995. PMID: 7697540 Free PMC article.
Cited by
-
The Magnitude and Functionality of SARS-CoV-2 Reactive Cellular and Humoral Immunity in Transplant Population Is Similar to the General Population Despite Immunosuppression.Transplantation. 2021 Oct 1;105(10):2156-2164. doi: 10.1097/TP.0000000000003755. Transplantation. 2021. PMID: 33988334 Free PMC article.
-
A curated compendium of monocyte transcriptome datasets of relevance to human monocyte immunobiology research.F1000Res. 2016 Apr 25;5:291. doi: 10.12688/f1000research.8182.2. eCollection 2016. F1000Res. 2016. PMID: 27158452 Free PMC article.
-
Systems analysis of high-throughput data.Adv Exp Med Biol. 2014;844:153-87. doi: 10.1007/978-1-4939-2095-2_8. Adv Exp Med Biol. 2014. PMID: 25480641 Free PMC article. Review.
-
An age-independent gene signature for monitoring acute rejection in kidney transplantation.Theranostics. 2020 May 25;10(15):6977-6986. doi: 10.7150/thno.42110. eCollection 2020. Theranostics. 2020. PMID: 32550916 Free PMC article.
-
Toxicity mechanisms identification via gene set enrichment analysis of time-series toxicogenomics data: impact of time and concentration.Environ Sci Technol. 2015 Apr 7;49(7):4618-26. doi: 10.1021/es505199f. Epub 2015 Mar 18. Environ Sci Technol. 2015. PMID: 25785649 Free PMC article.
References
-
- Perco P, Pleban C, Kainz A, Lukas A, Mayer B, et al. Gene expression and biomarkers in renal transplant ischemia reperfusion injury. Transpl Int. 2007;20:2–11. - PubMed
-
- Kamoun M. Mechanisms of chronic allograft dysfunction. Ther Drug Monit. 2006;28:14–18. - PubMed
-
- Boros P, Bromberg JS. New cellular and molecular immune pathways in ischemia/reperfusion injury. Am J Transplant. 2006;6:652–658. - PubMed
-
- Gould SJ, Hildreth JE, Booth AM. The evolution of alloimmunity and the genesis of adaptive immunity. Q Rev Biol. 2004;79:359–382. - PubMed
Publication types
MeSH terms
Substances
Grants and funding
LinkOut - more resources
Full Text Sources
Other Literature Sources
Medical
Molecular Biology Databases
Research Materials
