. 2010 Oct 14;6(10):e1001154.
doi: 10.1371/journal.pgen.1001154.

Characterising and predicting haploinsufficiency in the human genome

Affiliations

Characterising and predicting haploinsufficiency in the human genome

Ni Huang et al. PLoS Genet. .

Abstract

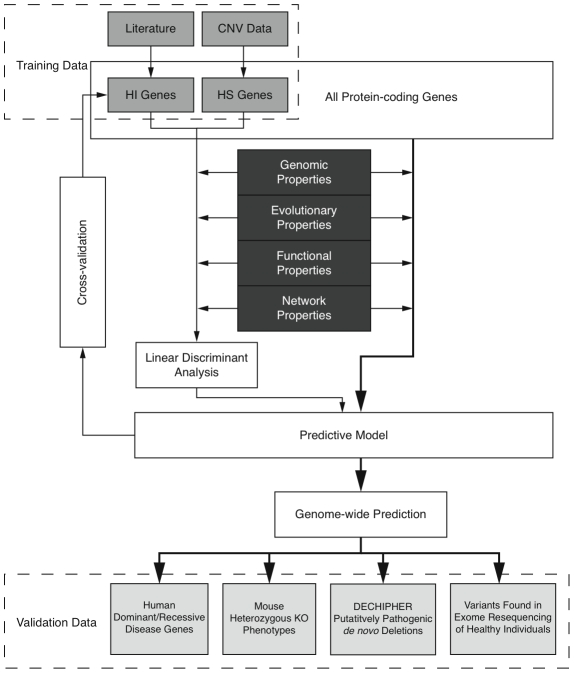
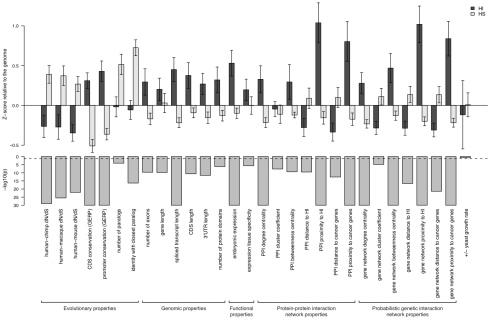
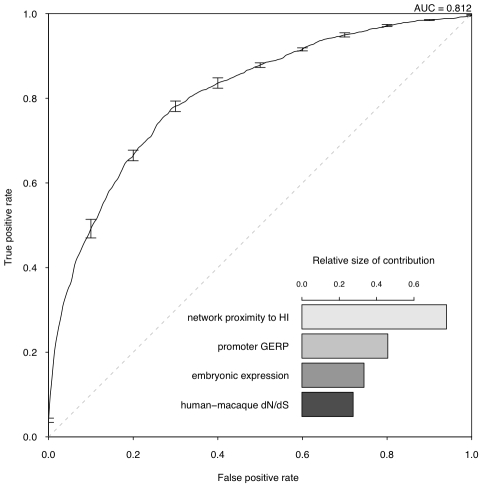
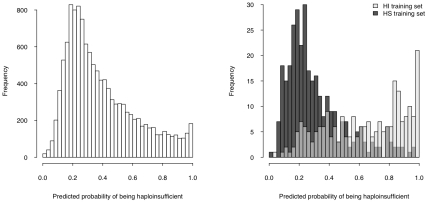
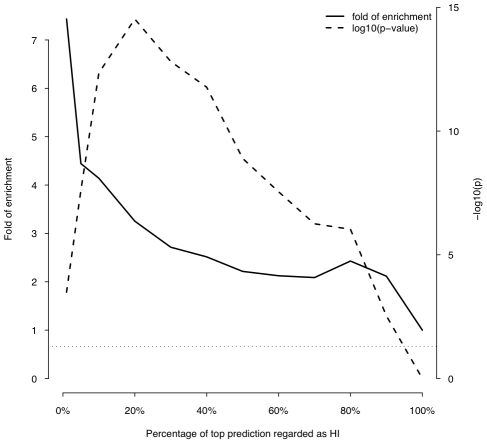
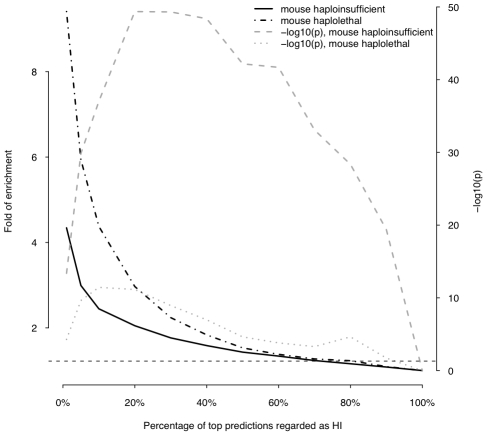
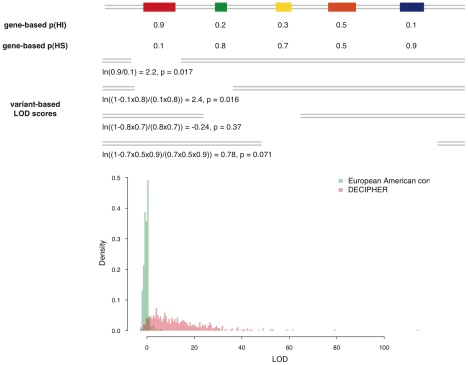
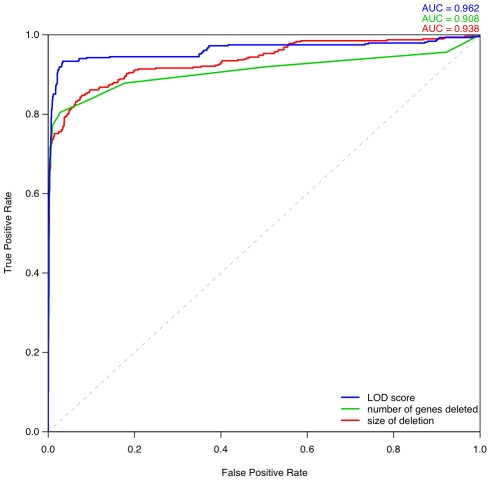
Haploinsufficiency, wherein a single functional copy of a gene is insufficient to maintain normal function, is a major cause of dominant disease. Human disease studies have identified several hundred haploinsufficient (HI) genes. We have compiled a map of 1,079 haplosufficient (HS) genes by systematic identification of genes unambiguously and repeatedly compromised by copy number variation among 8,458 apparently healthy individuals and contrasted the genomic, evolutionary, functional, and network properties between these HS genes and known HI genes. We found that HI genes are typically longer and have more conserved coding sequences and promoters than HS genes. HI genes exhibit higher levels of expression during early development and greater tissue specificity. Moreover, within a probabilistic human functional interaction network HI genes have more interaction partners and greater network proximity to other known HI genes. We built a predictive model on the basis of these differences and annotated 12,443 genes with their predicted probability of being haploinsufficient. We validated these predictions of haploinsufficiency by demonstrating that genes with a high predicted probability of exhibiting haploinsufficiency are enriched among genes implicated in human dominant diseases and among genes causing abnormal phenotypes in heterozygous knockout mice. We have transformed these gene-based haploinsufficiency predictions into haploinsufficiency scores for genic deletions, which we demonstrate to better discriminate between pathogenic and benign deletions than consideration of the deletion size or numbers of genes deleted. These robust predictions of haploinsufficiency support clinical interpretation of novel loss-of-function variants and prioritization of variants and genes for follow-up studies.


Conflict of interest statement

The authors have declared that no competing interests exist.

Figures

Figure 1
Figure 1. Outline of the prediction framework.
Figure 2
Figure 2. Properties that distinguish HI genes from HS genes.
The upper part of the figure shows the comparison of the mean of each individual property between HI genes and HS genes. The values are transformed to z-scores relative to the genome average. The error bars represent two times the standard error of the mean. The bars in the middle part shows the transformed p value (−log10(p)) of the Mann-Whitney U test on each property. The dashed line marks a p value of 0.05.
Figure 3
Figure 3. Assessment of model performance.
The ROC curve demonstrates the performance of the model evaluated by 10-fold cross-validation. The lower right part shows the relative contribution of each predictor variable to the prediction model measured by the absolute value of the scaling factor of each predictor variable constituting the linear discriminant.
Figure 4
Figure 4. Predicted probability of being haploinsufficient across the genome.
The histogram on the left shows the distribution of the predicted probability of being haploinsufficient ( p(HI) )of all 12,443 predictable genes. The histograms on the right shows the distribution of the predicted p(HI) of the HI training set (light grey) and the HS training set (dark grey).
Figure 5
Figure 5. Enrichment of predicted HI genes in dominant genes relative to recessive genes.
This plot shows the fold of enrichment of predicted HI genes in dominant genes relative to recessive genes (thick solid line) as a function of the proportion of top predictions labeled as being haploinsufficient. Also plotted is the transformed p value (−log10(p)) of the corresponding Fisher's exact test (thick dashed line). The horizontal dashed line marks the p value of 0.05.
Figure 6
Figure 6. Enrichment of predicted HI genes in orthologs of mouse haploinsufficient genes and mouse haplolethal genes.
This plot shows the fold of enrichment of predicted HI genes in human orthologs of mouse haploinsufficient genes (black solid line) and mouse haplolethal genes (black dashed line) relative to the genome average as a function of the proportion of top predictions labeled as being haploinsufficient. The two lines in grey show the transformed p values of the corresponding Fishers' exact test. The horizontal dashed line marks the p value of 0.05.
Figure 7
Figure 7. Calculation of deletion-based LOD scores and the distribution of LOD score of control individuals and pathogenic de novo deletions.
The upper portion of the figure is a schematic demonstration of the calculation of the deletion-based LOD score. The contribution of genes with high p(HI) is accordingly weighted in a probabilistic way. The deletion with the largest LOD score in each individual is recorded and their distribution is shown in the lower portion of the figure. The distribution of maximal LOD scores of 2,322 control individuals are shown in green and the distribution of LOD scores of 487 pathogenic de novo deletions from DECIPHER are in red. Using the control distribution as the null, the probability a deletion is pathogenic can be assessed.
Figure 8
Figure 8. Comparison of different metrics for assessing deletion pathogenicity.
Three ROC curves repesent the performance of three different methods for distinguishing between pathogenic deletions from DECIPHER and the most pathogenic deletions observed in control individuals. The blue curve denotes using LOD score calculated from predicted probability of exhibiting haploinsufficiency as the metric of pathogenicity. The green curve denotes using the number of genes deleted as the metric, in which case the most pathogenic deletion per individual is the one containing greatest number of genes in that individual. The red curve denotes using the size of deletion as the discriminating metric.

References

    1. Ng PC, Henikoff S. Predicting the effects of amino acid substitutions on protein function. Annu Rev Genomics Hum Genet. 2006;7:61–80. - PubMed
    1. Wilkie AOM. The molecular basis of genetic dominance. J Med Genet. 1994;31:89–98. - PMC - PubMed
    1. Xue Y, Daly A, Yngvadottir B, Liu M, Coop G, et al. Spread of an inactive form of caspase-12 in humans is due to recent positive selection. Am J Hum Genet. 2006;78:659–670. - PMC - PubMed
    1. Ng SB, Turner EH, Robertson PD, Flygare SD, Bigham AW, et al. Targeted capture and massively parallel sequencing of 12 human exomes. Nature. 2009;461:272–276. - PMC - PubMed
    1. Ng PC, Levy S, Huang J, Stockwell TB, Walenz BP, et al. Genetic variation in an individual human exome. PLoS Genet. 2008;4:e1000160. doi: 10.1371/journal.pgen.1000160. - DOI - PMC - PubMed

Publication types