

A covering method for detecting genetic associations between rare variants and common phenotypes
- PMID: 20976246
- PMCID: PMC2954823
- DOI: 10.1371/journal.pcbi.1000954
A covering method for detecting genetic associations between rare variants and common phenotypes
Abstract
Genome wide association (GWA) studies, which test for association between common genetic markers and a disease phenotype, have shown varying degrees of success. While many factors could potentially confound GWA studies, we focus on the possibility that multiple, rare variants (RVs) may act in concert to influence disease etiology. Here, we describe an algorithm for RV analysis, RareCover. The algorithm combines a disparate collection of RVs with low effect and modest penetrance. Further, it does not require the rare variants be adjacent in location. Extensive simulations over a range of assumed penetrance and population attributable risk (PAR) values illustrate the power of our approach over other published methods, including the collapsing and weighted-collapsing strategies. To showcase the method, we apply RareCover to re-sequencing data from a cohort of 289 individuals at the extremes of Body Mass Index distribution (NCT00263042). Individual samples were re-sequenced at two genes, FAAH and MGLL, known to be involved in endocannabinoid metabolism (187Kbp for 148 obese and 150 controls). The RareCover analysis identifies exactly one significantly associated region in each gene, each about 5 Kbp in the upstream regulatory regions. The data suggests that the RVs help disrupt the expression of the two genes, leading to lowered metabolism of the corresponding cannabinoids. Overall, our results point to the power of including RVs in measuring genetic associations.
Conflict of interest statement
The authors have declared that no competing interests exist.
Figures

 -values (obtained by permuting cases and controls) were plotted against each value of the
  statistic obtained over many tests over the entire range of simulation parameters, by varying sample size
  , locus PAR, and penetrance. As
  is the most significant subset among many possible subsets, the theoretical
  -value suggested by the
  distribution cannot be used directly. However, the plot shows that the locus
  value correlates tightly with the
  -value, implying that the union
  statistic can be used to filter the significant windows with no loss of power. The saturation at the ends is due to the number of trial being limited to
  .
.
 test cases were simulated. Each test-case was analyzed using
  methods, and the
  -value computed using
  permutations of cases and controls. The score is considered significant only if it is higher than all permuted values. The power of the test is the fraction of test-cases that had a significant score. R
 , or sample size.
 -axis describes the raw number of causal RVs (
 ), RVs recovered (
 ), their intersection, and the fraction recovered (
 , scaled for exposition). Close to
  of the causal RVs are recovered over a wide range of sample populations.
 ), Medium (
 ), and High (
 ). As the locus PAR values are low, power is computed as the fraction of
  simulations that showed significance at
  -value
  . Individuals were chosen from the lower (Control) and upper (Case) tails of the QT distribution. The power of all methods is compared using the
  % extremes (
 cases,
  controls), and the
  % (
% ( cases, and
  controls). R
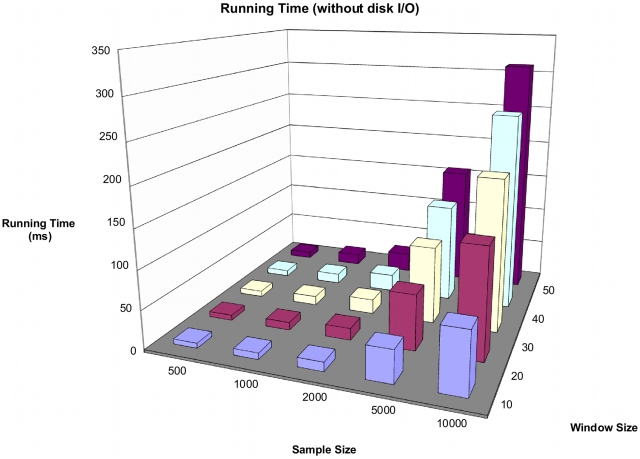
 ms to each run. The total running time is about twice that of single marker tests.
 Kbp in the re-sequenced region around FAAH. A
  -value was computed for each window using
  permutations of cases and controls. Each point corresponds to the
  -value of a single window starting at that location. The most significant window (described by the box) is
  Kbp upstream of the FAAH transcription start site. The region is part of an LTR element, which are known to carry regulatory signals, and is enriched in transcription factor binding sites, suggesting a regulatory role for the rare variants.
References
-
- Lander ES. The new genomics: global views of biology. Science. 1996;274:536–539. - PubMed
-
- Pritchard JK, Cox NJ. The allelic architecture of human disease genes: common disease-common variant…or not? Hum Mol Genet. 2002;11:2417–2423. - PubMed
-
- Reich DE, Lander ES. On the allelic spectrum of human disease. Trends Genet. 2001;17:502–510. - PubMed
Publication types
MeSH terms
Substances
Associated data
Grants and funding
- R01 HL089655-02/HL/NHLBI NIH HHS/United States
- U19 AG023122/AG/NIA NIH HHS/United States
- T32 HG002295/HG/NHGRI NIH HHS/United States
- U01 DA024417/DA/NIDA NIH HHS/United States
- P50 MH081755-01/MH/NIMH NIH HHS/United States
- U01 DA024417-01/DA/NIDA NIH HHS/United States
- U54 CA143906-01/CA/NCI NIH HHS/United States
- P50 MH081755/MH/NIMH NIH HHS/United States
- R01 AG030474/AG/NIA NIH HHS/United States
- N01 MH022005/MH/NIMH NIH HHS/United States
- T32 HG00229/HG/NHGRI NIH HHS/United States
- U19 AG023122-05/AG/NIA NIH HHS/United States
- R01 MH078151/MH/NIMH NIH HHS/United States
- R01 MH078151-03/MH/NIMH NIH HHS/United States
- R01 MH080134-03/MH/NIMH NIH HHS/United States
- UL1 RR025774/RR/NCRR NIH HHS/United States
- R01 HL089655/HL/NHLBI NIH HHS/United States
- R01 AG030474-02/AG/NIA NIH HHS/United States
- R01 MH080134/MH/NIMH NIH HHS/United States
- UL1RR025774-03/RR/NCRR NIH HHS/United States
- U54 CA143906/CA/NCI NIH HHS/United States
LinkOut - more resources
Full Text Sources
Medical
