

Balancing selection maintains a form of ERAP2 that undergoes nonsense-mediated decay and affects antigen presentation
- PMID: 20976248
- PMCID: PMC2954825
- DOI: 10.1371/journal.pgen.1001157
Balancing selection maintains a form of ERAP2 that undergoes nonsense-mediated decay and affects antigen presentation
Abstract
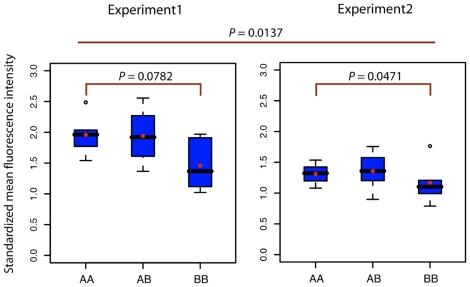
A remarkable characteristic of the human major histocompatibility complex (MHC) is its extreme genetic diversity, which is maintained by balancing selection. In fact, the MHC complex remains one of the best-known examples of natural selection in humans, with well-established genetic signatures and biological mechanisms for the action of selection. Here, we present genetic and functional evidence that another gene with a fundamental role in MHC class I presentation, endoplasmic reticulum aminopeptidase 2 (ERAP2), has also evolved under balancing selection and contains a variant that affects antigen presentation. Specifically, genetic analyses of six human populations revealed strong and consistent signatures of balancing selection affecting ERAP2. This selection maintains two highly differentiated haplotypes (Haplotype A and Haplotype B), with frequencies 0.44 and 0.56, respectively. We found that ERAP2 expressed from Haplotype B undergoes differential splicing and encodes a truncated protein, leading to nonsense-mediated decay of the mRNA. To investigate the consequences of ERAP2 deficiency on MHC presentation, we correlated surface MHC class I expression with ERAP2 genotypes in primary lymphocytes. Haplotype B homozygotes had lower levels of MHC class I expressed on the surface of B cells, suggesting that naturally occurring ERAP2 deficiency affects MHC presentation and immune response. Interestingly, an ERAP2 paralog, endoplasmic reticulum aminopeptidase 1 (ERAP1), also shows genetic signatures of balancing selection. Together, our findings link the genetic signatures of selection with an effect on splicing and a cellular phenotype. Although the precise selective pressure that maintains polymorphism is unknown, the demonstrated differences between the ERAP2 splice forms provide important insights into the potential mechanism for the action of selection.
Conflict of interest statement
The authors have declared that no competing interests exist.
Figures


Similar articles
-
Genetic diversity at endoplasmic reticulum aminopeptidases is maintained by balancing selection and is associated with natural resistance to HIV-1 infection.Hum Mol Genet. 2010 Dec 1;19(23):4705-14. doi: 10.1093/hmg/ddq401. Epub 2010 Sep 15. Hum Mol Genet. 2010. PMID: 20843824
-
Functionally distinct ERAP1 and ERAP2 are a hallmark of HLA-A29-(Birdshot) Uveitis.Hum Mol Genet. 2018 Dec 15;27(24):4333-4343. doi: 10.1093/hmg/ddy319. Hum Mol Genet. 2018. PMID: 30215709 Free PMC article.
-
A Short ERAP2 That Binds IRAP Is Expressed in Macrophages Independently of Gene Variation.Int J Mol Sci. 2022 Apr 29;23(9):4961. doi: 10.3390/ijms23094961. Int J Mol Sci. 2022. PMID: 35563348 Free PMC article.
-
Influence of ERAP1 and ERAP2 gene polymorphisms on disease susceptibility in different populations.Hum Immunol. 2019 May;80(5):325-334. doi: 10.1016/j.humimm.2019.02.011. Epub 2019 Feb 21. Hum Immunol. 2019. PMID: 30797823 Review.
-
Endoplasmic reticulum aminopeptidases: Biology and pathogenic potential.Nat Rev Rheumatol. 2010 Aug;6(8):461-7. doi: 10.1038/nrrheum.2010.85. Epub 2010 Jun 8. Nat Rev Rheumatol. 2010. PMID: 20531381 Review.
Cited by
-
Evolution of MHC class I in the order Crocodylia.Immunogenetics. 2014 Jan;66(1):53-65. doi: 10.1007/s00251-013-0746-1. Epub 2013 Nov 20. Immunogenetics. 2014. PMID: 24253731
-
Overexpression of ERAP2N in Human Trophoblast Cells Promotes Cell Death.Int J Mol Sci. 2021 Aug 10;22(16):8585. doi: 10.3390/ijms22168585. Int J Mol Sci. 2021. PMID: 34445292 Free PMC article.
-
Selection on a variant associated with improved viral clearance drives local, adaptive pseudogenization of interferon lambda 4 (IFNL4).PLoS Genet. 2014 Oct 16;10(10):e1004681. doi: 10.1371/journal.pgen.1004681. eCollection 2014 Oct. PLoS Genet. 2014. PMID: 25329461 Free PMC article.
-
ERAPs Reduce In Vitro HIV Infection by Activating Innate Immune Response.J Immunol. 2021 Apr 1;206(7):1609-1617. doi: 10.4049/jimmunol.2000991. Epub 2021 Feb 22. J Immunol. 2021. PMID: 33619214 Free PMC article.
-
The Evolution of Diagnostic Techniques in the Paleopathology of Tuberculosis: A Scoping Review.Pathog Immun. 2023 Oct 18;8(1):93-116. doi: 10.20411/pai.v8i1.597. eCollection 2023. Pathog Immun. 2023. PMID: 37900966 Free PMC article.
References
Publication types
MeSH terms
Substances
Grants and funding
LinkOut - more resources
Full Text Sources
Other Literature Sources
Research Materials
Miscellaneous
