Single-dose mucosal immunization with a candidate universal influenza vaccine provides rapid protection from virulent H5N1, H3N2 and H1N1 viruses
- PMID: 20976273
- PMCID: PMC2953831
- DOI: 10.1371/journal.pone.0013162
Single-dose mucosal immunization with a candidate universal influenza vaccine provides rapid protection from virulent H5N1, H3N2 and H1N1 viruses
Abstract
Background: The sudden emergence of novel influenza viruses is a global public health concern. Conventional influenza vaccines targeting the highly variable surface glycoproteins hemagglutinin and neuraminidase must antigenically match the emerging strain to be effective. In contrast, "universal" vaccines targeting conserved viral components could be used regardless of viral strain or subtype. Previous approaches to universal vaccination have required protracted multi-dose immunizations. Here we evaluate a single dose universal vaccine strategy using recombinant adenoviruses (rAd) expressing the conserved influenza virus antigens matrix 2 and nucleoprotein.
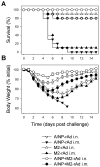
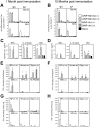
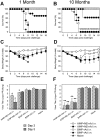
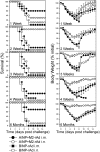
Methodology/principal findings: In BALB/c mice, administration of rAd via the intranasal route was superior to intramuscular immunization for induction of mucosal responses and for protection against highly virulent H1N1, H3N2, or H5N1 influenza virus challenge. Mucosally vaccinated mice not only survived, but had little morbidity and reduced lung virus titers. Protection was observed as early as 2 weeks post-immunization, and lasted at least 10 months, as did antibodies and lung T cells with activated phenotypes. Virus-specific IgA correlated with but was not essential for protection, as demonstrated in studies with IgA-deficient animals.
Conclusion/significance: Mucosal administration of NP and M2-expressing rAd vectors provided rapid and lasting protection from influenza viruses in a subtype-independent manner. Such vaccines could be used in the interval between emergence of a new virus strain and availability of strain-matched vaccines against it. This strikingly effective single-dose vaccination thus represents a candidate off-the-shelf vaccine for emergency use during an influenza pandemic.
Conflict of interest statement
Figures


Similar articles
-
Vaccination with Recombinant Parainfluenza Virus 5 Expressing Neuraminidase Protects against Homologous and Heterologous Influenza Virus Challenge.J Virol. 2017 Nov 14;91(23):e01579-17. doi: 10.1128/JVI.01579-17. Print 2017 Dec 1. J Virol. 2017. PMID: 28931689 Free PMC article.
-
Broadly protective immunity against divergent influenza viruses by oral co-administration of Lactococcus lactis expressing nucleoprotein adjuvanted with cholera toxin B subunit in mice.Microb Cell Fact. 2015 Aug 5;14:111. doi: 10.1186/s12934-015-0287-4. Microb Cell Fact. 2015. PMID: 26242406 Free PMC article.
-
M2SR, a novel live influenza vaccine, protects mice and ferrets against highly pathogenic avian influenza.Vaccine. 2017 Jul 24;35(33):4177-4183. doi: 10.1016/j.vaccine.2017.06.039. Epub 2017 Jun 28. Vaccine. 2017. PMID: 28668565 Free PMC article.
-
[Tetravaccine--new fundamental approach to prevention of influenza pandemic].Zh Mikrobiol Epidemiol Immunobiol. 2007 Jul-Aug;(4):15-9. Zh Mikrobiol Epidemiol Immunobiol. 2007. PMID: 17882832 Review. Russian.
-
Universal Influenza Vaccines: Progress in Achieving Broad Cross-Protection In Vivo.Am J Epidemiol. 2018 Dec 1;187(12):2603-2614. doi: 10.1093/aje/kwy145. Am J Epidemiol. 2018. PMID: 30084906 Free PMC article. Review.
Cited by
-
Mimotopes selected with neutralizing antibodies against multiple subtypes of influenza A.Virol J. 2011 Dec 15;8:542. doi: 10.1186/1743-422X-8-542. Virol J. 2011. PMID: 22171803 Free PMC article.
-
Development of Nasal Vaccines and the Associated Challenges.Pharmaceutics. 2022 Sep 20;14(10):1983. doi: 10.3390/pharmaceutics14101983. Pharmaceutics. 2022. PMID: 36297419 Free PMC article. Review.
-
Induction of cross-protection against influenza A virus by DNA prime-intranasal protein boost strategy based on nucleoprotein.Virol J. 2012 Nov 23;9:286. doi: 10.1186/1743-422X-9-286. Virol J. 2012. PMID: 23173785 Free PMC article.
-
Neutral Lipopolyplexes for In Vivo Delivery of Conventional and Replicative RNA Vaccine.Mol Ther Nucleic Acids. 2019 Sep 6;17:767-775. doi: 10.1016/j.omtn.2019.07.014. Epub 2019 Jul 30. Mol Ther Nucleic Acids. 2019. PMID: 31446119 Free PMC article.
-
Mucosal vaccines: novel strategies and applications for the control of pathogens and tumors at mucosal sites.Hum Vaccin Immunother. 2014;10(8):2175-87. doi: 10.4161/hv.29269. Hum Vaccin Immunother. 2014. PMID: 25424921 Free PMC article. Review.
References
-
- Carrat F, Flahault A. Influenza vaccine: the challenge of antigenic drift. Vaccine. 2007;25:6852–6862. - PubMed
-
- Leroux-Roels I, Leroux-Roels G. Current status and progress of prepandemic and pandemic influenza vaccine development. Expert Rev Vaccines. 2009;8:401–423. 10.1586/erv.09.15. - PubMed
-
- ‘Interim results: influenza A (H1N1) 2009 monovalent vaccination coverage --- United States, October-December 2009.’. MMWR Morb Mortal Wkly Rep. 59:44–48. - PubMed
-
- Dawood FS, Jain S, Finelli L, Shaw MW, Lindstrom S, et al. Emergence of a novel swine-origin influenza A (H1N1) virus in humans. N Engl J Med. 2009;360:2605–2615. - PubMed
-
- Brown LE, Kelso A. Prospects for an influenza vaccine that induces cross-protective cytotoxic T lymphocytes. Immunol Cell Biol. 2009;87:300–308. - PubMed
Publication types
MeSH terms
Substances
Grants and funding
LinkOut - more resources
Full Text Sources
Other Literature Sources
Medical
Miscellaneous

