

Wnt1 and BMP2: two factors recruiting multipotent neural crest progenitors isolated from adult bone marrow
- PMID: 20976520
- PMCID: PMC11114799
- DOI: 10.1007/s00018-010-0558-5
Wnt1 and BMP2: two factors recruiting multipotent neural crest progenitors isolated from adult bone marrow
Abstract
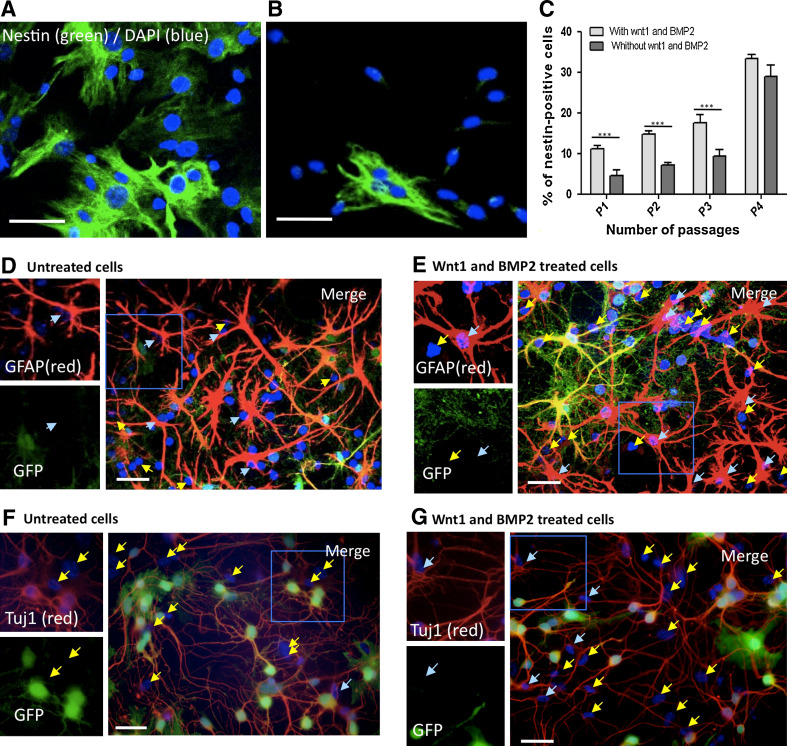
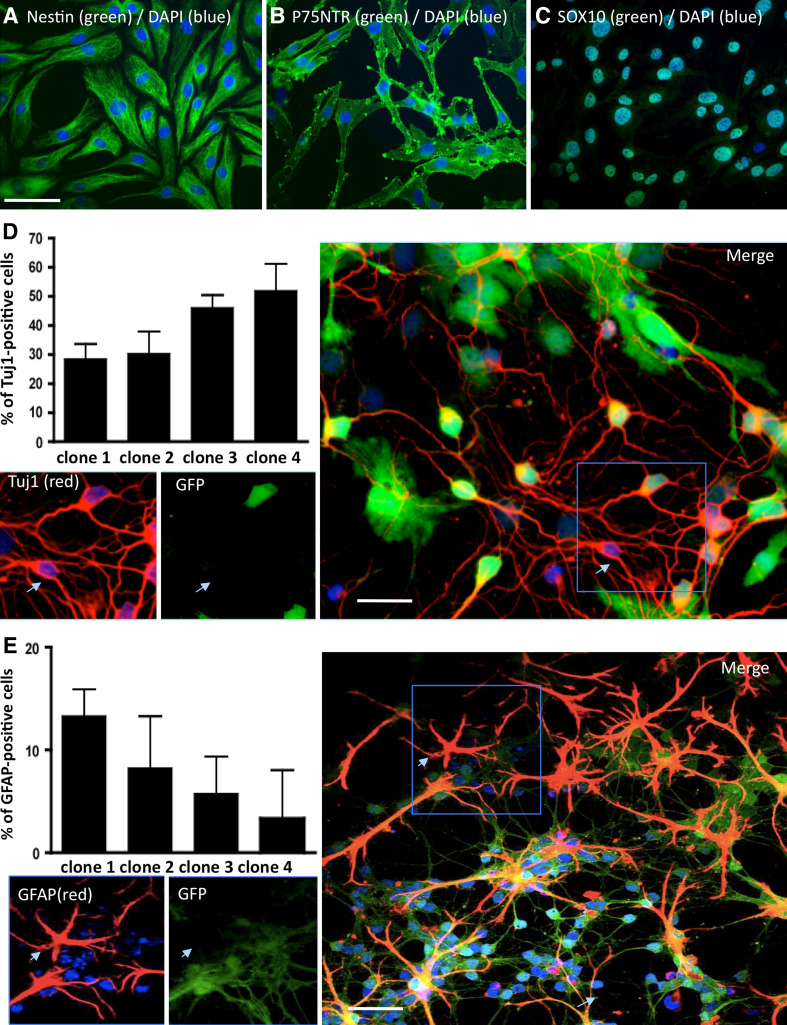
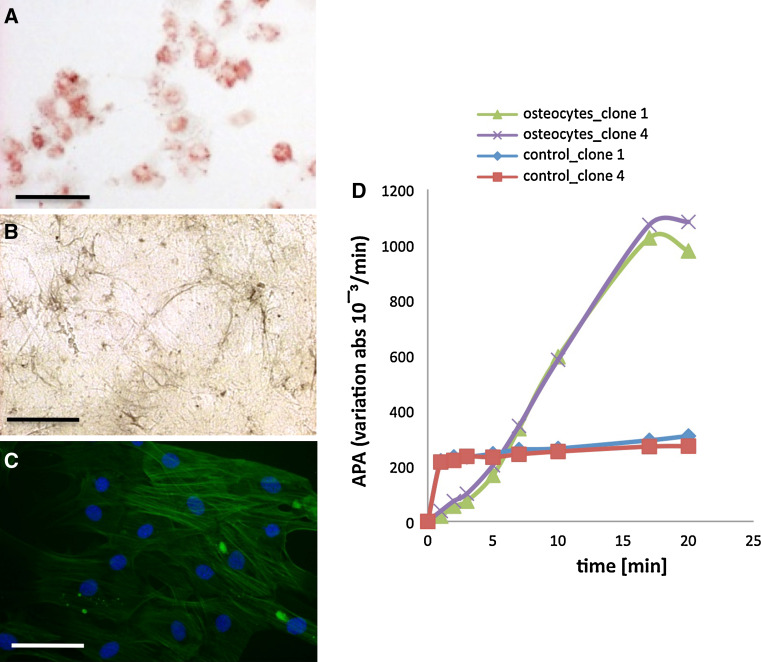
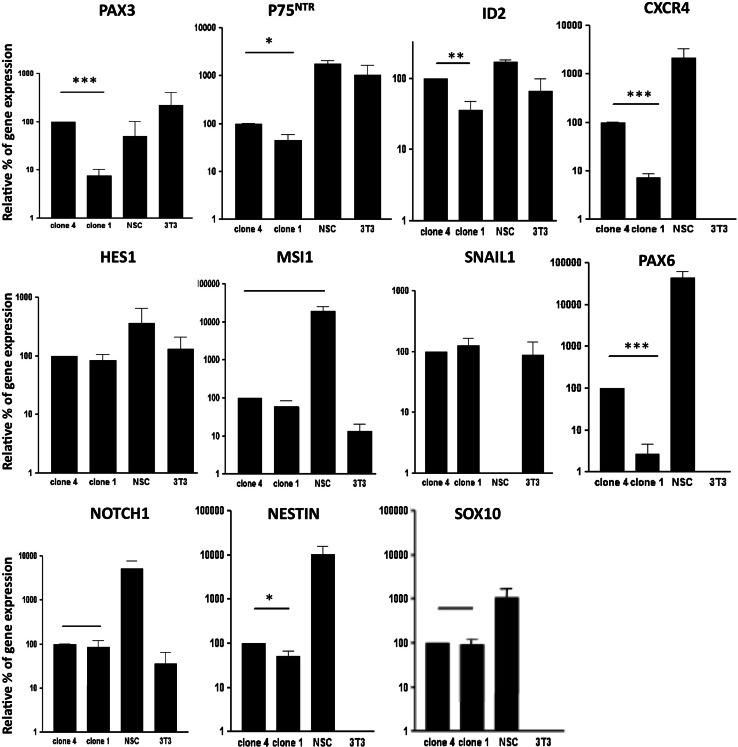
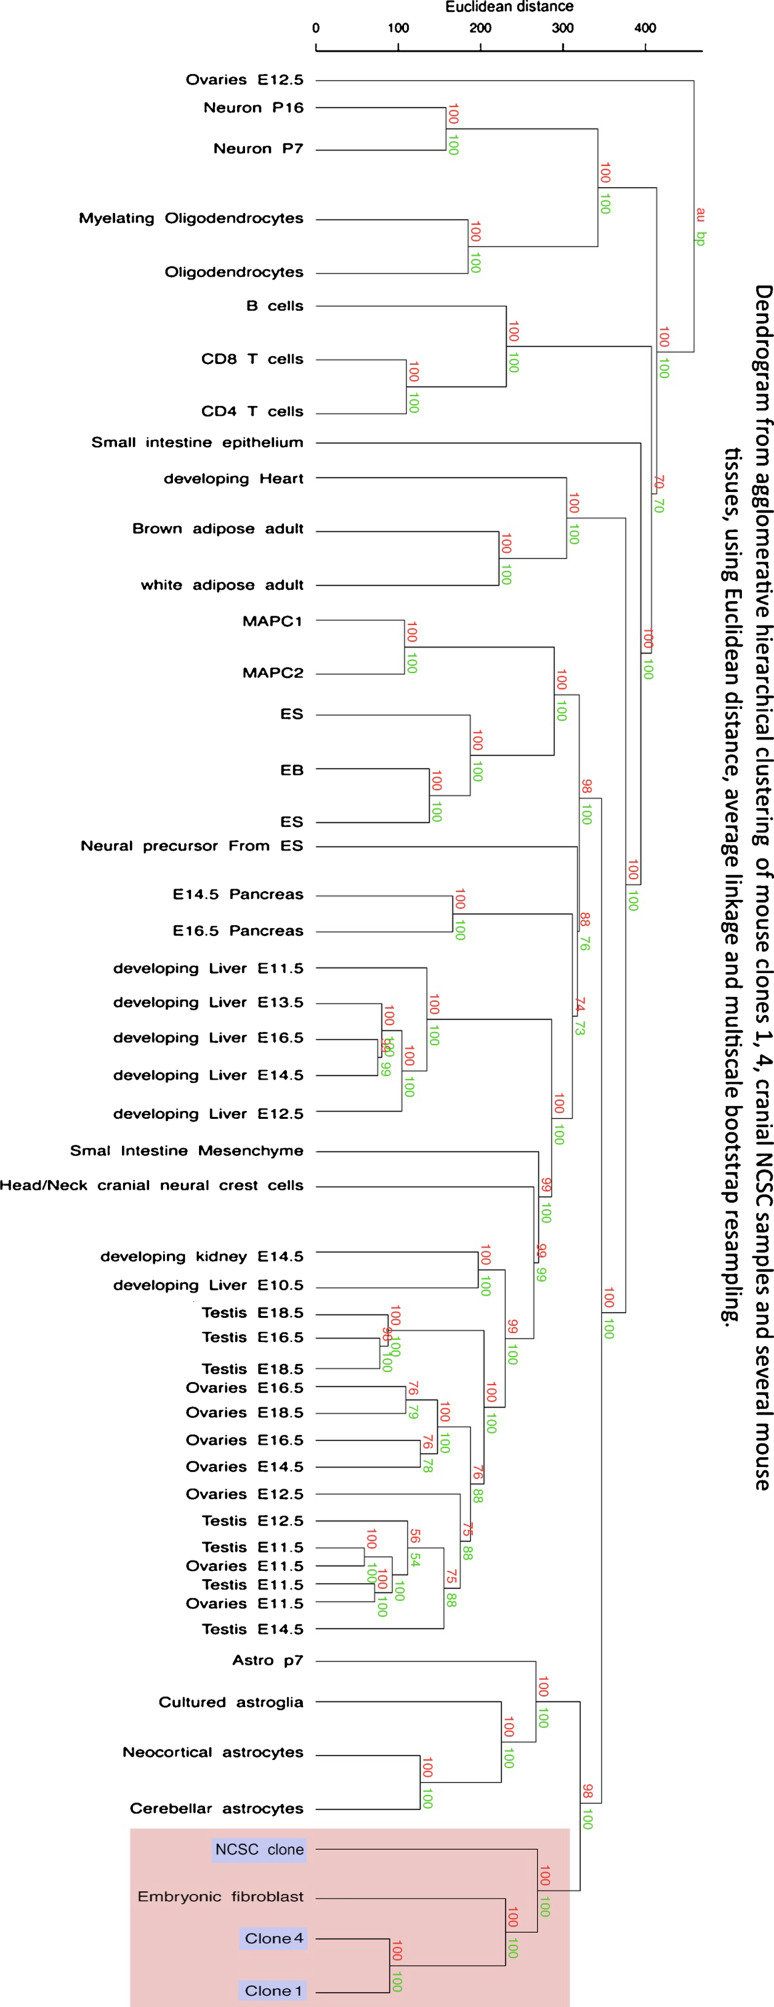
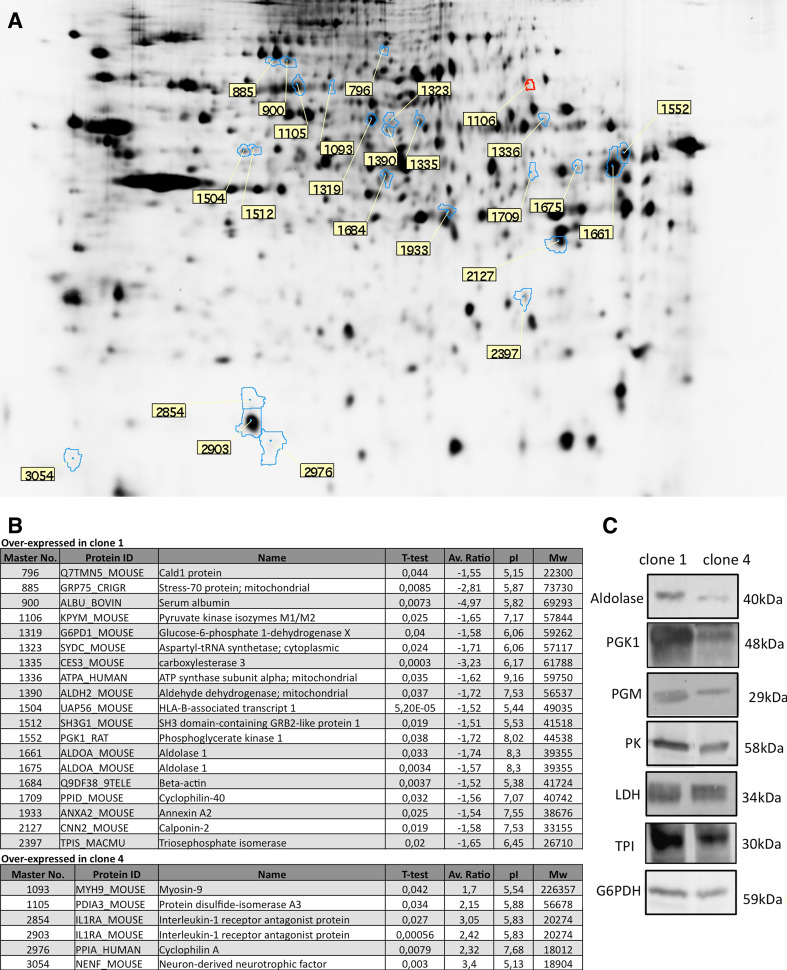
Recent studies have shown that neural crest-derived progenitor cells can be found in diverse mammalian tissues including tissues that were not previously shown to contain neural crest derivatives, such as bone marrow. The identification of those "new" neural crest-derived progenitor cells opens new strategies for developing autologous cell replacement therapies in regenerative medicine. However, their potential use is still a challenge as only few neural crest-derived progenitor cells were found in those new accessible locations. In this study, we developed a protocol, based on wnt1 and BMP2 effects, to enrich neural crest-derived cells from adult bone marrow. Those two factors are known to maintain and stimulate the proliferation of embryonic neural crest stem cells, however, their effects have never been characterized on neural crest cells isolated from adult tissues. Using multiple strategies from microarray to 2D-DIGE proteomic analyses, we characterized those recruited neural crest-derived cells, defining their identity and their differentiating abilities.
Figures
Similar articles
-
Ontogeny and multipotency of neural crest-derived stem cells in mouse bone marrow, dorsal root ganglia, and whisker pad.Cell Stem Cell. 2008 Apr 10;2(4):392-403. doi: 10.1016/j.stem.2008.03.005. Cell Stem Cell. 2008. PMID: 18397758
-
Requirement for Foxd3 in the maintenance of neural crest progenitors.Development. 2008 May;135(9):1615-24. doi: 10.1242/dev.012179. Epub 2008 Mar 26. Development. 2008. PMID: 18367558 Free PMC article.
-
Isolation of multipotent neural crest-derived stem cells from the adult mouse cornea.Stem Cells. 2006 Dec;24(12):2714-22. doi: 10.1634/stemcells.2006-0156. Epub 2006 Aug 3. Stem Cells. 2006. PMID: 16888282
-
Neural crest progenitors and stem cells: from early development to adulthood.Dev Biol. 2012 Jun 1;366(1):83-95. doi: 10.1016/j.ydbio.2012.02.035. Epub 2012 Mar 8. Dev Biol. 2012. PMID: 22425619 Review.
-
Uncovering the In Vivo Source of Adult Neural Crest Stem Cells.Stem Cells Dev. 2017 Mar 1;26(5):303-313. doi: 10.1089/scd.2016.0297. Epub 2017 Feb 1. Stem Cells Dev. 2017. PMID: 27923324 Review.
Cited by
-
Correction: Human bone marrow harbors cells with neural crest-associated characteristics like human adipose and dermis tissues.PLoS One. 2021 Sep 28;16(9):e0256484. doi: 10.1371/journal.pone.0256484. eCollection 2021. PLoS One. 2021. PMID: 34582493 Free PMC article.
-
Contribution of neural crest-derived stem cells and nasal chondrocytes to articular cartilage regeneration.Cell Mol Life Sci. 2020 Dec;77(23):4847-4859. doi: 10.1007/s00018-020-03567-y. Epub 2020 Jun 5. Cell Mol Life Sci. 2020. PMID: 32504256 Free PMC article. Review.
-
Correction: In Vivo Tumorigenesis Was Observed after Injection of In Vitro Expanded Neural Crest Stem Cells Isolated from Adult Bone Marrow.PLoS One. 2021 Sep 28;16(9):e0256477. doi: 10.1371/journal.pone.0256477. eCollection 2021. PLoS One. 2021. PMID: 34582485 Free PMC article.
-
The neural crest is a source of mesenchymal stem cells with specialized hematopoietic stem cell niche function.Elife. 2014 Sep 25;3:e03696. doi: 10.7554/eLife.03696. Elife. 2014. PMID: 25255216 Free PMC article.
-
The role of purinergic receptors in stem cell differentiation.Comput Struct Biotechnol J. 2014 Nov 7;13:75-84. doi: 10.1016/j.csbj.2014.11.003. eCollection 2015. Comput Struct Biotechnol J. 2014. PMID: 26900431 Free PMC article. Review.
References
-
- Baker CV, Bronner-Fraser M, Le Douarin NM, Teillet MA. Early- and late-migrating cranial neural crest cell populations have equivalent developmental potential in vivo. Development. 1997;124:3077–3087. - PubMed
Publication types
MeSH terms
Substances
LinkOut - more resources
Full Text Sources
