. 2010 Nov;2(11):472-86.
doi: 10.1002/emmm.201000101.

p21 loss blocks senescence following Apc loss and provokes tumourigenesis in the renal but not the intestinal epithelium

Affiliations

p21 loss blocks senescence following Apc loss and provokes tumourigenesis in the renal but not the intestinal epithelium

Alicia M Cole et al. EMBO Mol Med. 2010 Nov.

Abstract

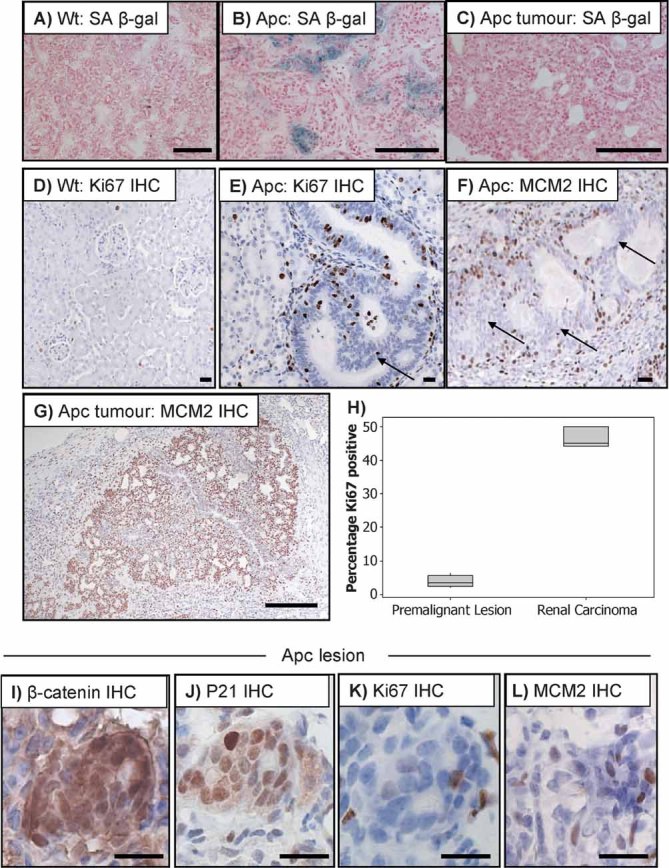
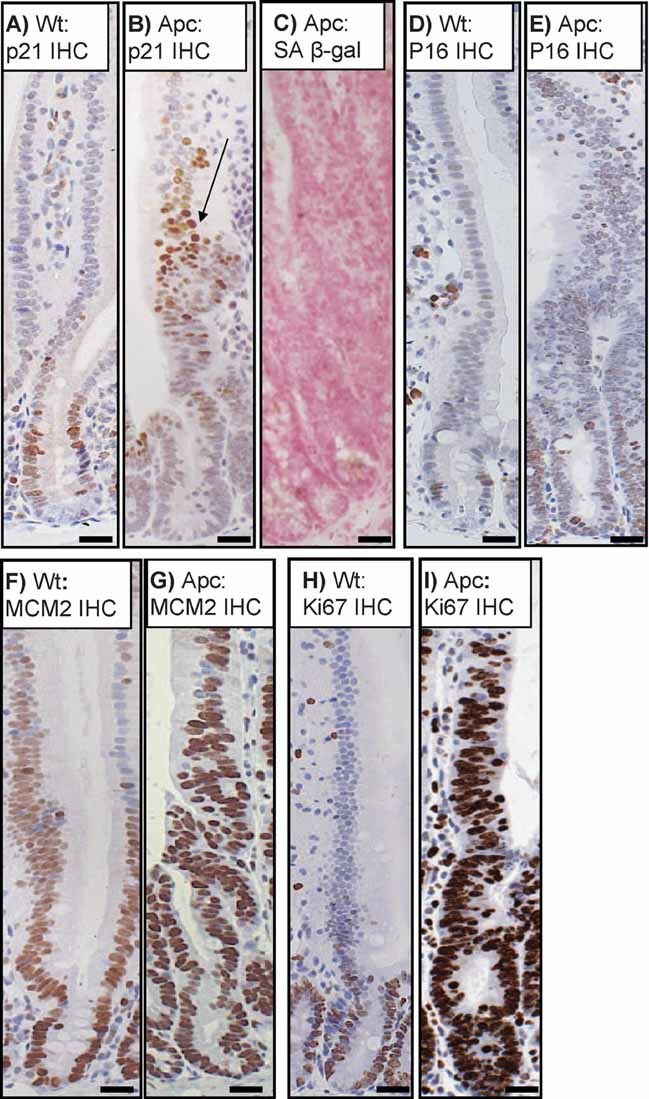
Senescence has been implicated as an important mechanism of tumour suppression in a number of human malignancies, including colorectal cancer (CRC). However, we still have a relatively poor understanding of how the underlying mutations that occur in cancer cause senescence and its relevance in vivo. The Apc gene is mutated in approximately 80% of CRC as the initiating event, but rarely elsewhere. In this study we have examined the capacity of Apc loss to induce senescence in the intestinal epithelium compared to the renal epithelium. Within the renal epithelium, loss of Apc function led to an induction of senescence, however, bypassing senescence through combined Apc and p21 or Ink4A gene deletion rapidly initiated renal carcinoma. Within the intestinal epithelium, loss of Apc did not induce senescence. Moreover, combined Apc and p21 or Ink4A loss had no impact upon tumourigenesis. Taken together, these results show that Apc loss in vivo invokes a senescence program in a context-dependent fashion, and implies senescence may play a key barrier to tumourigenesis in the kidney. However, in CRC, escape from senescence is likely to only be a barrier in cancers initiated by other mutations.


Figures

Figure 1
Figure 1. Apc deletion within the renal epithelium leads to rapid deletion of recombined cells and an upregulation of senescent markers
A and B. Kidneys imaged on OV100 microscope. A. Mice at P3 and 6 months imaged for RFP. Note kidneys from AhCre mice without the Rosa26 tdRFP reporter (labelled Neg) show little RFP positivity, whilst AhCre Rosa26 tdRFP mice (labelled RFP) on figure show marked RFP positivity. B. Mice imaged at 2 months (2 mo), top panel and 6 months (6 mo) bottom panels for GFP. Top panel (left kidney), note strong positivity for GFP in AhCre+ Z/EG+ Apc+/+ (labelled GFP). Middle kidney is from AhCre Z/EG+ Apcfl/fl (labelled Neg) shows only autoflourescence. Right kidney shows no detectable GFP positivity in AhCre+ Z/EG+ Apcfl/fl (labelled Apc) kidney at 2 months. In these mice recombination can only been seen via staining for GFP by IHC (Supporting Information 1D–F) as single cells are below the detection of the OV100. Bottom panel shows at 6 months a small number of positive foci within AhCre+ Z/EG+ Apcfl/fl kidneys, suggesting that Apc deficient cells are being deleted. C. β-catenin IHC showing that there is only a small number of β-catenin nuclear positive cells within the kidneys of AhCre+ Apcfl/fl mice. D. Bar graph showing percentage of AhCre+ Apcfl/fl mice with single nuclear β-catenin cells across kidney, premalignant lesions and renal carcinoma at 2, 6 and 12 months of age. At least ten mice were aged to each timepoint. E. β-catenin IHC showing nuclear localization in small renal lesions. F–H. IHC performed on AhCre+ Apcfl/fl kidneys, showing scattered cells and premalignant lesions staining for p21 (F and G) and p16 (H and I). J. Co-immunofluorescence (IF) for β-catenin (red) and p21 (green) showing high expression of both within premalignant lesions from AhCre+ Apcfl/fl mice. K and L IHC for p21 (K) and p16 (L) in renal carcinoma from AhCre+ Apcfl/fl mice, showing markedly reduced levels compared to premalignant lesions. In all cases scale bars represent 20 µm.
Figure 2
Figure 2. Apc deficient lesions are not proliferative
A–C. SA β-galactosidase staining performed on wild-type (A), AhCre+ Apcfl/fl kidneys with premalignant lesions (B) and tumours from AhCre+ Apcfl/fl kidneys (C). Note accumulation of SA β-gal is only observed in the premalignant lesions. Scale bars (A–C) represent 200 µm. D–E. Ki67 IHC showing only a small subset of cell expressing Ki67 in both wt (D) and small lesions from AhCre+ Apcfl/fl mice (E). F. MCM2 IHC showing low levels of proliferation in small lesions from AhCre+ Apcfl/fl mice, arrows show epithelial cells with low levels of proliferation. (see Supporting Information 3A for pan keratin staining showing the epithelial cells). Scale bars (D–F) represent 20 µm. G. IHC for MCM2 showing that renal carcinomas that grow out from AhCre+ Apcfl/fl mice are highly proliferative. Scale bars represent 200 µm. H. Boxplot showing significantly increased Ki67 staining in renal carcinomas compared to very low levels within the premalignant lesions. I–L. IHC showing high levels of β-catenin (I) and p21 (J), but low levels of the proliferation markers Ki67 (K), and MCM2 (L) in small Apc deficient renal lesions. Scale bars (I–L) represent 20 µm.
Figure 3
Figure 3. p21 loss following Apc deletion leads to rapid onset of renal tumourigenesis
A. Kaplan–Meier survival graph showing a dramatic acceleration of renal tumourigenesis in AhCre+ Apcfl/fl p21−/− mice (Apc p21−/−, n = 31, median lifespan 63 days, blue line) compared with AhCre+ Apc+/+ (Wt n = 20, <400 days) and AhCre+ Apcfl/fl mice (Apc, n = 23, red line, Log rank v Apcfl/fl p21−/−, p < 0.001). Note there was a marked acceleration of tumourigenesis in AhCre+ Apcfl/fl p21+/− mice (Apc p21+/− median lifespan 117 days, n = 17, green line, Log rank v Apcfl/fl p < 0.001). B. H&E of a renal tumour in AhCre+ Apcfl/fl p21−/− mice. C–E. Staining shows absence of senescent markers SA β-gal (C), p16 (D) and p21 (E) in AhCre+ Apcfl/fl p21−/− renal tumours. Note there is a small amount non-specific brown staining in the p21 knockout tumours when p21 IHC is performed (black arrow), however all nuclei are blue showing a complete loss of p21 within the tumours (red arrow). F. β-catenin IHC showing continued Wnt signalling activation in AhCre+ Apcfl/fl p21−/− deficient renal tumours. G and H Ki67 IHC (G) and MCM2 IHC (H) showing a marked increase in proliferation in AhCre+ Apcfl/fl p21−/− deficient tumours. Scale bars represent 200 µm.
Figure 4
Figure 4. p21 upregulation following Apc deletion does not induce senescence within the intestinal epithelium
A and B p21 IHC showing a low expression of p21 in a small number of cells in wild-type crypts (labelled Wt) at the crypt villus junction (A), as well as strong upregulation in a subset of cells in the villus following Apc loss in AhCre+ Apcfl/fl mice (labelled Apc) (B). C. Apc deficient crypts are not senescent as shown by lack of SA β-gal staining. D and E p16 IHC showing no major upregulation between wt (D) and Apc deficient crypts (E). F and G IHC showing an upregulation of MCM2 staining in the proliferative crypts of Wt mice (F), MCM2 is upregulated in all Apc deficient cells (G). H and I IHC showing an upregulation of Ki67 staining in the proliferative crypts of wt mice (H), Ki67 is upregulated in all Apc deficient cells (I). Scale bars represent 20 µm.
Figure 5
Figure 5. Apc deletion does not induce OIS within the intestine
A–D. Small intestinal adenomas arising in ApcMin/+ mice at 85 days. IHC showing high levels of β-catenin (A), p21 (B) and Ki67 (C) within adenomas. (D) Intestinal adenomas from ApcMin/+ mice lack expression of senescence marker SA β-gal. E. Apc deficient intestinal lesions that grow out from a non-stem cell ‘hit’ (1.0 mg/kg oral gavage), display high levels of β-catenin (E), with some expression of p21 (F) and high levels of proliferative markers Ki67 (G) and MCM2 (H). I–L. Lgr5-EGFP+-Cre-ER Apcfl/fl mice were treated with a single intraperitoneal injection of tamoxifen to induce recombination in the intestinal stem cell, resulting in intestinal adenoma formation at 24 days. Scale bars (A–H) represent 20 µm. (I) β-catenin IHC showing high levels of expression within intestinal adenomas. J. p21 IHC showing upregulation in intestinal adenomas. K and L IHC showing high levels of proliferation as illustrated by Ki67 (K) and MCM2 (L). Scale bars (I–L) represent 200 µm.
Figure 6
Figure 6. Deletion of p21 or Ink4a does not affect intestinal tumourigenesis
  1. Kaplan–Meier survival graph showing no acceleration of intestinal tumourigenesis between AhCre+ Apcfl/+ (Apcfl/+, n = 15, black line) and AhCre+ Apcfl/+ p21−/− (Apcfl/+ p21−/−, n = 24, red line) mice (Log rank, p = 0.476). No significant differences were observed either in total tumour number (Mann–Whitney, p = 0.1893) (B), or average tumour area (Mann–Whitney, p = 0.1346) (C).

  2. Survival graph showing no acceleration of tumourigenesis between Min (ApcMin/+, n = 20 black line), Min Ink4a+/− (ApcMin/+ Ink4a+/−, n = 23, red line) and Min Ink4a−/− (ApcMin/+ Ink4a−/−, n = 25, green line) mice (Log rank, p = 0.825). No significant differences were observed either in total tumour number (Mann–Whitney p = 0.7405) (E) or average tumour size (Mann–Whitney, p = 0.1601) (F).

Figure 7
Figure 7. c-myc deletion does not affect onset of tumour development
A. Kaplen–Meier survival graph showing no difference in time to renal tumourigenesis between AhCre+ Apcfl/fl p21−/− (Apc p21, n = 31, black line) and AhCre+ Apcfl/fl c-Mycfl/fl p21−/− mice (Apc c-Myc p21, n = 20, red line) (Log rank p = 0.571), illustrating that c-myc deletion does not affect onset of renal tumourigenesis. B. H&E showing AhCre+ Apcfl/fl c-Mycf/fl p21−/− triple knockout renal tumours. C. Absence of SA β-gal staining in AhCre+ Apcfl/fl c-Mycf/fl p21−/− triple knockout renal tumours. D. β-catenin IHC in AhCre+ Apcfl/fl c-Mycf/fl p21−/− triple knockout renal tumours shows nuclear localization. E. c-Myc IHC showing upregulation of c-Myc in AhCre+ Apcfl/fl p21−/− renal tumours. F. c-Myc IHC shows lack of c-Myc expression in AhCre+ Apcfl/fl c-Mycf/fl p21−/− triple knockout renal tumours, showing c-Myc is not required for tumourigenesis. Scale bars (B–F) represent 200 µm. G and H Strong upregulation of proliferative markers Ki67 (G) and MCM2 (H) showing AhCre+ Apcfl/fl c-Mycf/fl p21−/− triple knockout renal tumours deficient tumours are highly proliferative. Scale bars (G and H) represent 20 µm.
Figure 8
Figure 8. Model highlighting that both the initiating mutation and the tissue context determine the biological outcome and downstream tumour progression

Similar articles

Cited by

References

    1. Andreu P, Colnot S, Godard C, Gad S, Chafey P, Niwa-Kawakita M, Laurent-Puig P, Kahn A, Robine S, Perret C, et al. Crypt-restricted proliferation and commitment to the Paneth cell lineage following Apc loss in the mouse intestine. Development. 2005;132:1443–1451. - PubMed
    1. Baena E, Gandarillas A, Vallespinos M, Zanet J, Bachs O, Redondo C, Fabregat I, Martinez C, de Alboran IM. c-Myc regulates cell size and ploidy but is not essential for postnatal proliferation in liver. Proc Natl Acad Sci USA. 2005;102:7286–7291. - PMC - PubMed
    1. Barker N, van Es JH, Kuipers J, Kujala P, van den Born M, Cozijnsen M, Haegebarth A, Korving J, Begthel H, Peters PJ, et al. Identification of stem cells in small intestine and colon by marker gene Lgr5. Nature. 2007;449:1003–1007. - PubMed
    1. Barker N, Ridgway RA, van Es JH, van de Wetering M, Begthel H, van den Born M, Danenberg E, Clarke AR, Sansom OJ, Clevers H. Crypt stem cells as the cells-of-origin of intestinal cancer. Nature. 2009;457:608–611. - PubMed
    1. Bartek J, Lukas J, Bartkova J. DNA damage response as an anti-cancer barrier—damage threshold and the concept of ‘conditional haploinsufficiency’. Cell Cycle. 2007;6:2344–2347. - PubMed

Publication types

Substances