Review
. 2010 Nov;10(11):1675-88.
doi: 10.1586/ern.10.162.

Quantitative structural MRI for early detection of Alzheimer's disease

Affiliations
Review

Quantitative structural MRI for early detection of Alzheimer's disease

Linda K McEvoy et al. Expert Rev Neurother. 2010 Nov.

Abstract

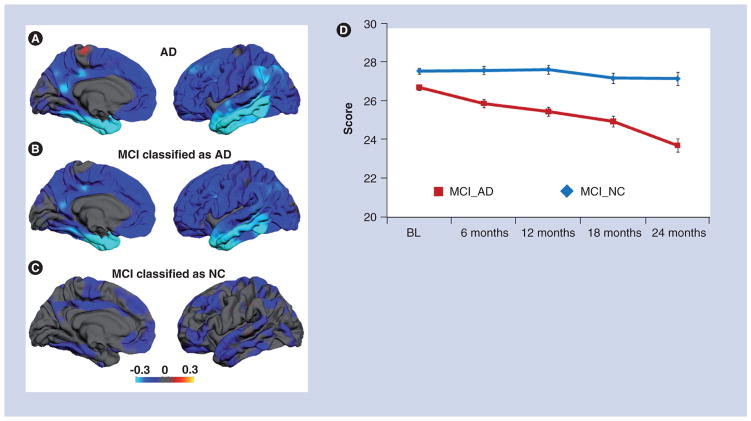
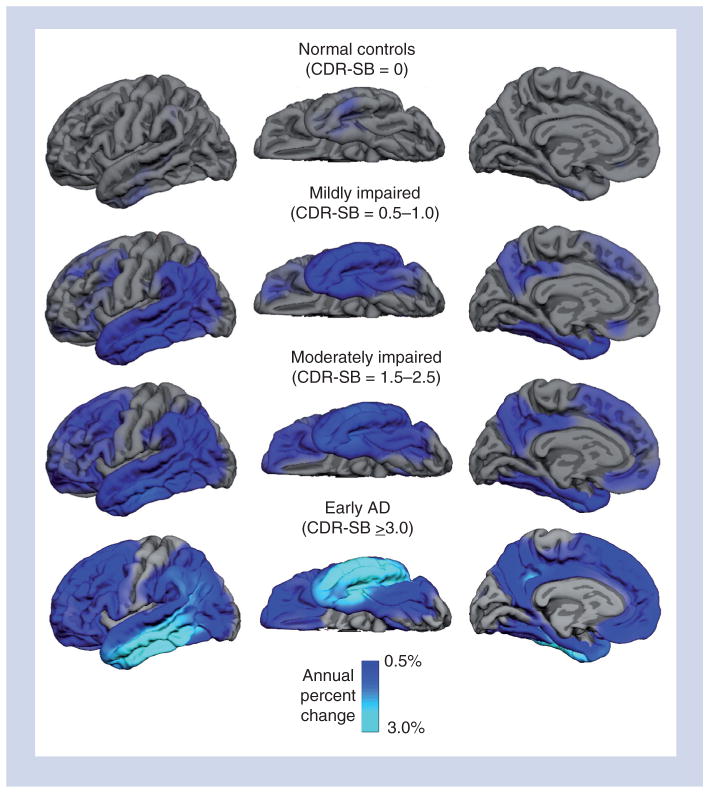
Alzheimer's disease (AD) is a common progressive neurodegenerative disorder that is not currently diagnosed until a patient reaches the stage of dementia. There is a pressing need to identify AD at an earlier stage, so that treatment, when available, can begin early. Quantitative structural MRI is sensitive to the neurodegeneration that occurs in mild and preclinical AD, and is predictive of decline to dementia in individuals with mild cognitive impairment. Objective evidence of ongoing brain atrophy will be critical for risk/benefit decisions once potentially aggressive, disease-modifying treatments become available. Recent advances have paved the way for the use of quantitative structural MRI in clinical practice, and initial clinical use has been promising. However, further experience with these measures in the relatively unselected patient populations seen in clinical practice is needed to complete translation of the recent enormous advances in scientific knowledge of AD into the clinical realm.


Figures

Figure 1
Figure 1. Regional atrophy patterns in mild Alzheimer’s disease and mild cognitive impairment
(A) The average difference in thickness (mm) for 84 patients with mild AD relative to 139 controls are shown on medial (left) and lateral (right) views of the pial surface of the left hemisphere. Greatest thinning is observed in medial and lateral temporal areas, but significant thinning also appears across association cortices. (B) Average thickness difference for MCI subjects who were classified as ‘AD’ by a discriminant and control data. Although less severe, the atrophy pattern is very similar to that of AD subjects. (C) MCI subjects classified as ‘normal control’ by the discriminant model. These subjects show significantly less atrophy, particularly in medial temporal regions, subjects classified as ’AD’. For all brain images, the scale reflects thickness differences ranging from −0.3 (yellow) (D) Average Mini-Mental State Examination score over time for MCI subjects classified as ‘AD’ and those classified with phenotypic AD atrophy showed significant, steady cognitive decline over a 2-year period, whereas those without the phenotypic AD atrophy pattern remained cognitively stable. Brain images are reprinted with permission from [60]. AD: Alzheimer’s disease; BL: Baseline; MCI: Mild cognitive impairment; NC: Normal control.
Figure 2
Figure 2. Annual atrophy rates as a function of degree of clinical impairment as assessed with baseline CDR-SB
Mean atrophy rates are represented as a percent change in neocortical volume and mapped onto the lateral (left), ventral (middle) and medial (right) pial surface of the left hemisphere. These data demonstrate that atrophy rates are most prominent in medial and lateral temporal regions early in the course of disease, spreading to parietal and frontal regions as the level of impairment increases, with relative sparing of sensorimotor regions. The scale reflects annual percent change ranging from 0.5 (dark blue) to 3.0%. Note that the scale is optimized for showing disease-related change, rather than change in normal aging. CDR-SB: Clinical Dementia Rating Sum of Boxes score. Reprinted with permission from [58].
Figure 3
Figure 3. NeuroQuant report from a mild cognitive impairment patient scanned longitudinally for 2 years as a volunteer in the Alzheimer’s Disease Neuroimaging Initiative study
Ten scans (two from each timepoint) were analyzed using NeuroQuant. From top to bottom, the report consists of demographic information; a row of axial, coronal and sagittal MR images with a color overlay of the segmentation results; a table reporting the volume, the volume as a percent of intracranial volume and the volume’s percentile score based on the normative database for bilateral hippocampus, lateral ventricle and temporal horn of the lateral ventricle; and normative graphs plotting the patient’s hippocampus volume and temporal horn volume, corrected for intracranial volume, relative to the expected range (in white) across the age range included in the normative database. For this patient, the baseline hippocampal volume of 5.09cc –corrected for age, sex and intracranial volume – was more than two standard deviations below that expected for their age, and continued to atrophy at a rate faster than would be expected in normal aging. The baseline temporal horn volume of 4.25cc was at the 77th percentile of that expected for age, and continued to enlarge at a rate faster than would be expected in normal aging. The patient progressed to Alzheimer’s disease at year 2.

References

    1. The Alzheimer’s Association. Alzheimer’s disease facts and figures. Alzheimers Dement. 2010;6(2):158–194. - PubMed
    1. Qiu C, Kivipelto M, von Strauss E. Epidemiology of Alzheimer’s disease: occurrence, determinants, and strategies toward intervention. Dialogues Clin Neurosci. 2009;11(2):111–128. - PMC - PubMed
    1. Ferri CP, Prince M, Brayne C, et al. Global prevalence of dementia: a Delphi consensus study. Lancet. 2005;366(9503):2112–2117. - PMC - PubMed
    1. Rafii MS, Aisen PS. Recent developments in Alzheimer’s disease therapeutics. BMC Med. 2009;7:7. - PMC - PubMed
    1. Cummings JL, Doody R, Clark C. Disease-modifying therapies for Alzheimer disease: challenges to early intervention. Neurology. 2007;69(16):1622–1634. - PubMed

Website

    1. Alzheimer’s Association: Recommendations to Update Diagnostic Criteria. www.alz.org/research/diagnostic_criteria.

Publication types