. 2010 Nov;10(11):2410-20.
doi: 10.1111/j.1600-6143.2010.03291.x.

Expression of CD39 by human peripheral blood CD4+ CD25+ T cells denotes a regulatory memory phenotype

Affiliations

Expression of CD39 by human peripheral blood CD4+ CD25+ T cells denotes a regulatory memory phenotype

K M Dwyer et al. Am J Transplant. 2010 Nov.

Abstract

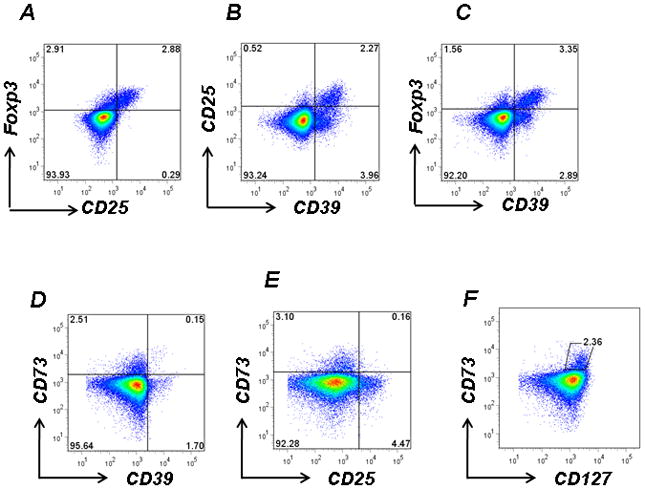
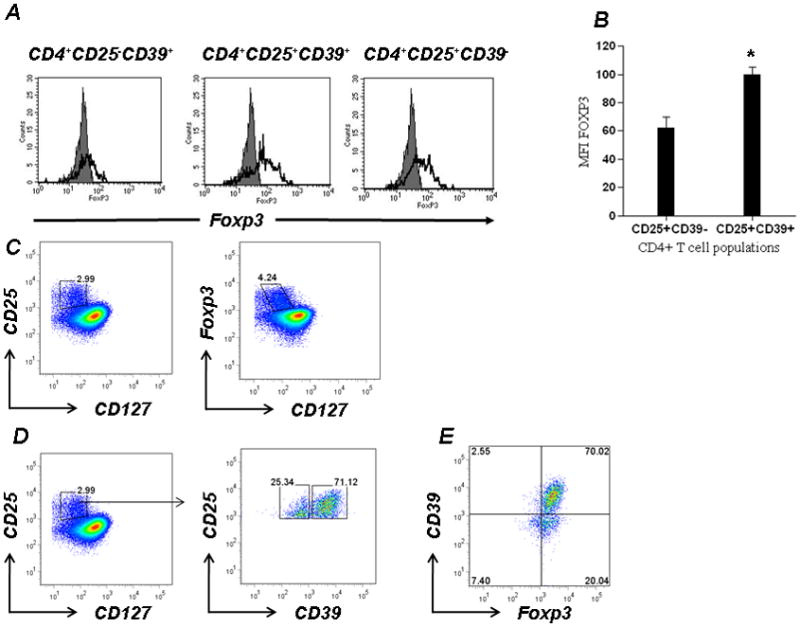
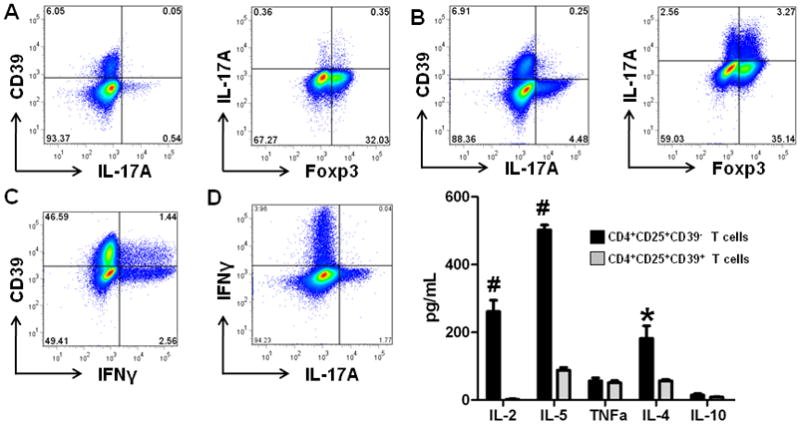
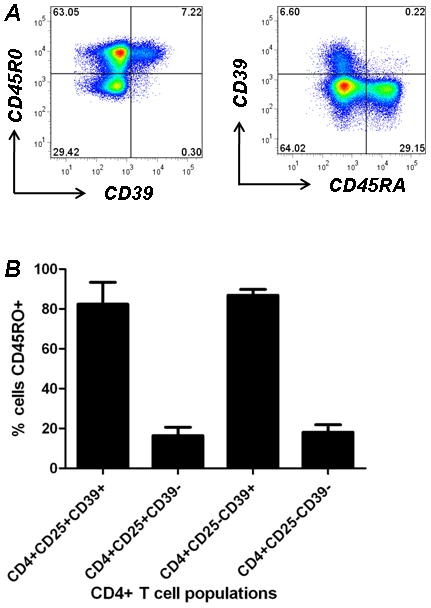
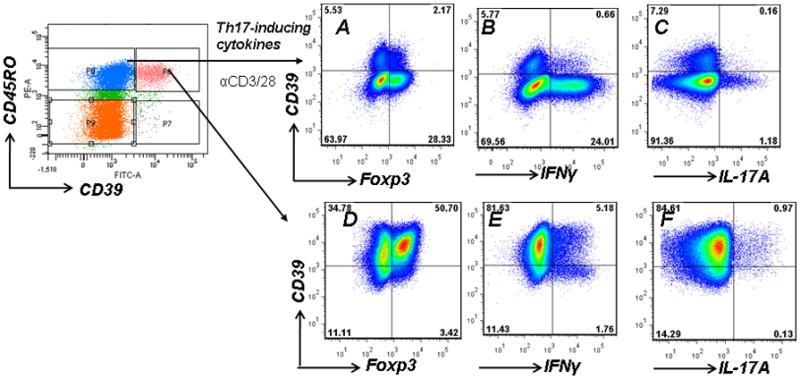
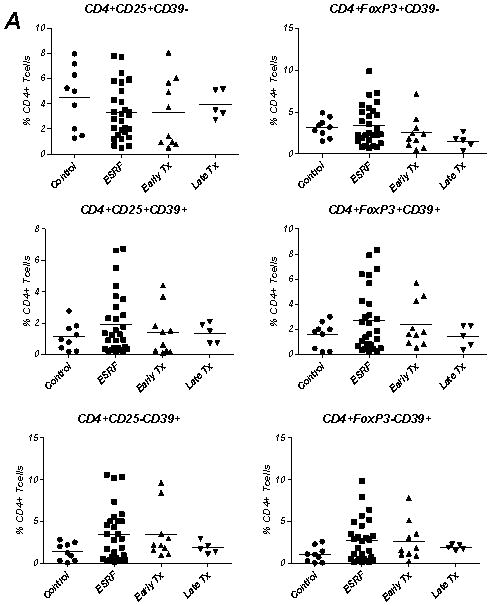
We have shown that CD39 and CD73 are coexpressed on the surface of murine CD4+ Foxp3+ regulatory T cells (Treg) and generate extracellular adenosine, contributing to Treg immunosuppressive activity. We now describe that CD39, independently of CD73, is expressed by a subset of blood-derived human CD4+ CD25+ CD127lo Treg, defined by robust expression of Foxp3. A further distinct population of CD4+ CD39+ T lymphocytes can be identified, which do not express CD25 and FoxP3 and exhibit the memory effector cellular phenotype. Differential expression of CD25 and CD39 on circulating CD4+ T cells distinguishes between Treg and pathogenic cellular populations that secrete proinflammatory cytokines such as IFNγ and IL-17. These latter cell populations are increased, with a concomitant decrease in the CD4+ CD25+ CD39+ Tregs, in the peripheral blood of patients with renal allograft rejection. We conclude that the ectonucleotidase CD39 is a useful and dynamic lymphocytes surface marker that can be used to identify different peripheral blood T cell-populations to allow tracking of these in health and disease, as in renal allograft rejection.


Figures

Figure 1
Figure 1. CD4+ T cell populations are defined by differential CD4 CD25 and CD39 expression
A. Human CD4+ T cells were isolated by Ficoll gradients, stained with anti-human CD25 and intracellularly labeled with Foxp3 then analyzed by FACS. B, C. Human CD4+ T cells were stained with CD25, Foxp3 and CD39. The additional use of CD39 as a phenotypic marker identifies four distinct CD4+ T cell populations. Mutually exclusive expression of CD73 and CD39 or CD25 by CD4+ T cells D, E. PBMCs obtained from healthy controls were stained with anti-human CD73, CD39 and CD25. Expression of CD73 appeared largely independent of either CD39 or CD25 expression. F. CD73 was expressed at high levels on CD127high T cells Data denote representative findings for ≥ 20 independent experiments
Figure 2
Figure 2. CD4+CD25+CD39+ T cells have an activated Treg molecular signature
A. CD4+ T cells were stained with CD39-FITC and CD25-PE and analyzed for intracellular Foxp3 staining (open histogram). B. The mean fluorescence intensity (MFI) for Foxp3 staining in CD4+CD25+CD39+/− T cells populations is shown (*p<0.05). C. PBMCs obtained from peripheral blood were freshly stained without previous in vitro stimulation and stained with anti-human CD25 and anti-human CD127 and labeled with Foxp3. Expression of CD25 is restricted to CD127low population, while expression of Foxp3 extends to the CD127int population. D. Treg cells identified based on low expression of CD127 and high expression of CD25 were stained with anti-human CD39. CD4+CD25+CD127low T cells contain 2 distinct populations comprising cells that are either CD39high or CD39low. E. CD4+CD25+CD127low T cells were stained with anti-human CD39 and labeled with Foxp3. CD39high T cells are largely Foxp3+ while CD39low cells contain an admixture of Foxp3+ and Foxp3 T cells. Data denote representative findings for ≥ 3 independent experiments.
Figure 3
Figure 3. Lack of CD39 expression by CD4+CD25+ cells with Th17 potential
A. CD4+CD25+ T cells were stimulated by anti-CD3/CD28 and analyzed for CD39, Foxp3 and IL-17A expression. CD4+CD25+ T cells were cultured in the presence of IL-1β, IL-2, IL-23 and TGFβ1 and then analyzed for CD39, Foxp3 and IL-17A (B); CD39 and IFNγ (C) and IFNγ and IL-17 (D) expression. E.CD4+CD25+CD39+/− T cells were cultured with PMA for 72 hours and the supernatant analyzed for cytokine secretion. CD4+CD25+CD39 T cells (black bars); CD4+CD25+CD39+ T cells (grey bars). Data represents average ± SD (n=3); *p<0.05; #p<0.01 Data are representative of more than 3 experiments.
Figure 4
Figure 4. CD4+ CD39+ T cells are memory T cells
A. Human CD4+ Tcells were stained with anti-human CD39, CD45RO and CD45RA. CD4+CD39+ T cells are CD45RA and CD45RO+. B. Percentage of CD45RO+ cells within each CD4+ T cell population. Data denote findings for ≥ 6 independent experiments
Fig. 5
Fig. 5. CD4+CD25CD39+ T cells produce both IFNγ and IL-17A
CD4+CD45RO+CD39 T cells were cultured under Th17 polarizing conditions and analyzed for CD39 and Foxp3 (A), IFNγ (B) and IL-17A (C) expression. CD4+CDRO+CD39+ T cells were cultured under Th17 polarizing conditions and analyzed for CD39 and Foxp3 (D), IFNγ (E) and IL-17A (F) expression. Data are representative of more than 3 experiments.
Figure 6
Figure 6. Definition of T cell CD4+CD25+/−CD39+/− populations in patients with end stage renal failure and following renal transplantation
A. PBMCs were obtained and analyzed by flow cytometry from controls (n=9), patients with end stage renal failure (ESRF) (n=28), those in the early transplant period (post-operative day 1–6) (Early Tx) (n=10) and patients with stable allograft function at least 5 years post transplantation (Late Tx) (n=5). The percentage of CD4+CD25+/−(Foxp3+/−)CD39+/− T cells in each patient group was calculated. There were no significant differences noted between the groups. B. Representative histological sections of allograft rejection (H&E) i) Marked interstitial hemorrhage and edema with fibrinoid change in peritubular capillary (arrow) ii) Severe glomerulitis iii) Mild glomerulitis and inflammatory cells in ecstatic peritubular capillaries iv) Transmural arteritis with severe intimal arteritis and focal myocyte necrosis (arrows) C. Peripheral blood CD4+ T cells were obtained from four renal transplant patients during allograft rejection and analyzed for CD4+CD25+/−CD39+/− expression by flow cytometry. The CD4+CD25CD39+ T cell population was increased during allograft rejection compared with both controls and stable late transplant recipients (*p<0.01). D. The ratio of CD4+CD25CD39+ (Tmeff): CD4+CD25+CD39+ (mTreg) was determined at the time of allograft rejection. An increase in the Tmeff and concomitant decrease in mTreg was observed.

References

    1. Deaglio S, Dwyer KM, Gao W, Friedman D, Usheva A, Erat A, et al. Adenosine generation catalyzed by CD39 and CD73 expressed on regulatory T cells mediates immune suppression. J Exp Med. 2007 Jun 11;204(6):1257–65. - PMC - PubMed
    1. Robson SC, Kaczmarek E, Siegel JB, Candinas D, Koziak K, Millan M, et al. Loss of ATP diphosphohydrolase activity with endothelial cell activation. J Exp Med. 1997 Jan 6;185(1):153–63. - PMC - PubMed
    1. Zimmermann H. 5′-Nucleotidase: molecular structure and functional aspects. Biochem J. 1992 Jul 15;285( Pt 2):345–65. - PMC - PubMed
    1. Kobie JJ, Shah PR, Yang L, Rebhahn JA, Fowell DJ, Mosmann TR. T regulatory and primed uncommitted CD4 T cells express CD73, which suppresses effector CD4 T cells by converting 5′-adenosine monophosphate to adenosine. J Immunol. 2006 Nov 15;177(10):6780–6. - PubMed
    1. Zhou Q, Yan J, Putheti P, Wu Y, Sun X, Toxavidis V, et al. Isolated CD39 expression on CD4+ T cells denotes both regulatory and memory populations. Am J Transplant. 2009 Oct;9(10):2303–11. - PMC - PubMed

Publication types

MeSH terms