

Exendin-4 suppresses SRC activation and reactive oxygen species production in diabetic Goto-Kakizaki rat islets in an Epac-dependent manner
- PMID: 20978090
- PMCID: PMC3012174
- DOI: 10.2337/db10-0021
Exendin-4 suppresses SRC activation and reactive oxygen species production in diabetic Goto-Kakizaki rat islets in an Epac-dependent manner
Abstract
Objective: Reactive oxygen species (ROS) is one of most important factors in impaired metabolism secretion coupling in pancreatic β-cells. We recently reported that elevated ROS production and impaired ATP production at high glucose in diabetic Goto-Kakizaki (GK) rat islets are effectively ameliorated by Src inhibition, suggesting that Src activity is upregulated. In the present study, we investigated whether the glucagon-like peptide-1 signal regulates Src activity and ameliorates endogenous ROS production and ATP production in GK islets using exendin-4.
Research design and methods: Isolated islets from GK and control Wistar rats were used for immunoblotting analyses and measurements of ROS production and ATP content. Src activity was examined by immunoprecipitation of islet lysates followed by immunoblotting. ROS production was measured with a fluorescent probe using dispersed islet cells.
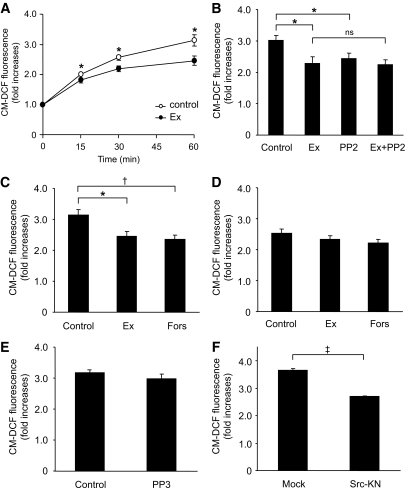
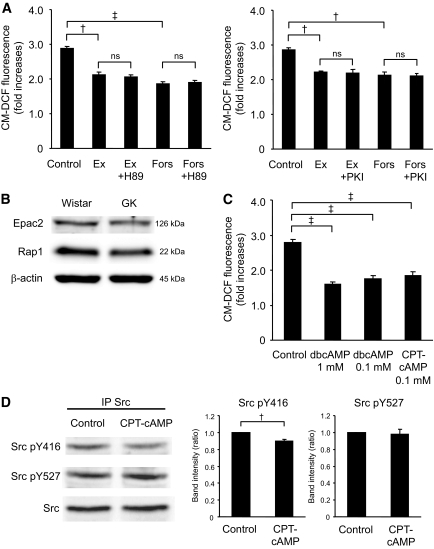
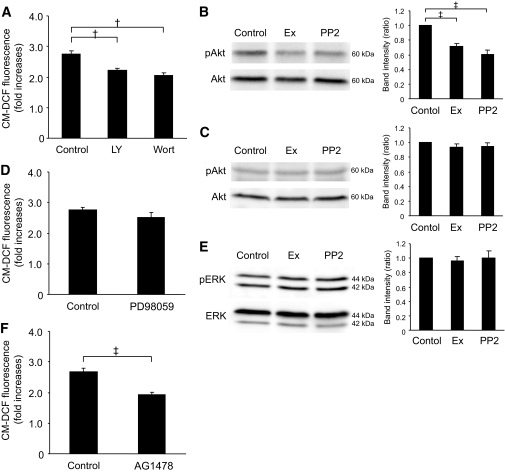
Results: Exendin-4 significantly decreased phosphorylation of Src Tyr416, which indicates Src activation, in GK islets under 16.7 mmol/l glucose exposure. Glucose-induced ROS production (16.7 mmol/l) in GK islet cells was significantly decreased by coexposure of exendin-4 as well as PP2, a Src inhibitor. The Src kinase-negative mutant expression in GK islets significantly decreased ROS production induced by high glucose. Exendin-4, as well as PP2, significantly increased impaired ATP elevation by high glucose in GK islets. The decrease in ROS production by exendin-4 was not affected by H-89, a PKA inhibitor, and an Epac-specific cAMP analog (8CPT-2Me-cAMP) significantly decreased Src Tyr416 phosphorylation and ROS production.
Conclusions: Exendin-4 decreases endogenous ROS production and increases ATP production in diabetic GK rat islets through suppression of Src activation, dependently on Epac.
Figures


Similar articles
-
Src activation generates reactive oxygen species and impairs metabolism-secretion coupling in diabetic Goto-Kakizaki and ouabain-treated rat pancreatic islets.Diabetologia. 2008 Jul;51(7):1226-35. doi: 10.1007/s00125-008-1008-x. Epub 2008 May 1. Diabetologia. 2008. PMID: 18449527
-
Role of endogenous ROS production in impaired metabolism-secretion coupling of diabetic pancreatic β cells.Prog Biophys Mol Biol. 2011 Nov;107(2):304-10. doi: 10.1016/j.pbiomolbio.2011.07.013. Epub 2011 Aug 5. Prog Biophys Mol Biol. 2011. PMID: 21839765 Review.
-
Inhibition of protein-tyrosine phosphatases stimulates insulin secretion in pancreatic islets of diabetic Goto-Kakizaki rats.Pancreas. 2005 May;30(4):314-7. doi: 10.1097/01.mpa.0000161887.25115.6c. Pancreas. 2005. PMID: 15841039
-
Gene expression regulated by pioglitazone and exenatide in normal and diabetic rat islets exposed to lipotoxicity.Diabetes Metab Res Rev. 2009 Feb;25(2):163-84. doi: 10.1002/dmrr.896. Diabetes Metab Res Rev. 2009. PMID: 19065603
-
Persistent improvement of type 2 diabetes in the Goto-Kakizaki rat model by expansion of the beta-cell mass during the prediabetic period with glucagon-like peptide-1 or exendin-4.Diabetes. 2002 May;51(5):1443-52. doi: 10.2337/diabetes.51.5.1443. Diabetes. 2002. PMID: 11978641
Cited by
-
Reducing Glucokinase Activity Restores Endogenous Pulsatility and Enhances Insulin Secretion in Islets From db/db Mice.Endocrinology. 2018 Nov 1;159(11):3747-3760. doi: 10.1210/en.2018-00589. Endocrinology. 2018. PMID: 30239634 Free PMC article.
-
Efficacy and safety of alogliptin added to sulfonylurea in Japanese patients with type 2 diabetes: A randomized, double-blind, placebo-controlled trial with an open-label, long-term extension study.J Diabetes Investig. 2012 Dec 20;3(6):517-25. doi: 10.1111/j.2040-1124.2012.00226.x. Epub 2012 Jul 12. J Diabetes Investig. 2012. PMID: 24843617 Free PMC article.
-
Does Glucagon-like Peptide-1 Ameliorate Oxidative Stress in Diabetes? Evidence Based on Experimental and Clinical Studies.Curr Diabetes Rev. 2016;12(4):331-358. doi: 10.2174/1573399812666150918150608. Curr Diabetes Rev. 2016. PMID: 26381142 Free PMC article. Review.
-
The old second messenger cAMP teams up with novel cell death mechanisms: potential translational therapeutical benefit for Alzheimer's disease and Parkinson's disease.Front Physiol. 2023 Jun 19;14:1207280. doi: 10.3389/fphys.2023.1207280. eCollection 2023. Front Physiol. 2023. PMID: 37405135 Free PMC article. Review.
-
Effects of Glucagon-Like Peptide-1 on Oxidative Stress and Nrf2 Signaling.Int J Mol Sci. 2017 Dec 22;19(1):26. doi: 10.3390/ijms19010026. Int J Mol Sci. 2017. PMID: 29271910 Free PMC article. Review.
References
-
- Maechler P, Wollheim CB: Mitochondrial function in normal and diabetic beta-cells. Nature 2001;414:807–812 - PubMed
-
- Maechler P, Jornot L, Wollheim CB: Hydrogen peroxide alters mitochondrial activation and insulin secretion in pancreatic beta cells. J Biol Chem 1999;274:27905–27913 - PubMed
-
- Bindokas VP, Kuznetsov A, Sreenan S, Polonsky KS, Roe MW, Philipson LH: Visualizing superoxide production in normal and diabetic rat islets of Langerhans. J Biol Chem 2003;278:9796–9801 - PubMed
-
- Sakai K, Matsumoto K, Nishikawa T, Suefuji M, Nakamaru K, Hirashima Y, Kawashima J, Shirotani T, Ichinose K, Brownlee M, Araki E: Mitochondrial reactive oxygen species reduce insulin secretion by pancreatic beta-cells. Biochem Biophys Res Commun 2003;300:216–222 - PubMed
Publication types
MeSH terms
Substances
LinkOut - more resources
Full Text Sources
Other Literature Sources
Medical
Miscellaneous
