

Body and liver fat mass rather than muscle mitochondrial function determine glucose metabolism in women with a history of gestational diabetes mellitus
- PMID: 20978097
- PMCID: PMC3024362
- DOI: 10.2337/dc10-1002
Body and liver fat mass rather than muscle mitochondrial function determine glucose metabolism in women with a history of gestational diabetes mellitus
Abstract
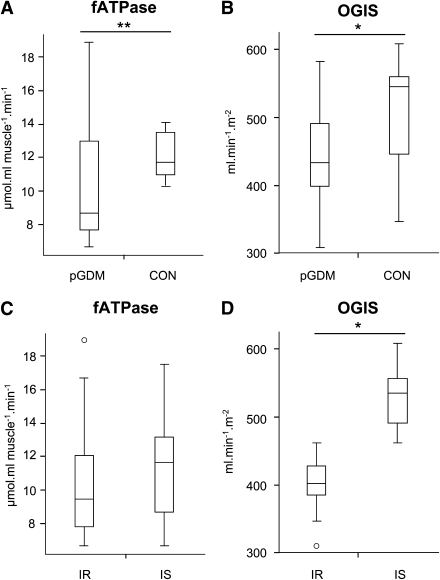
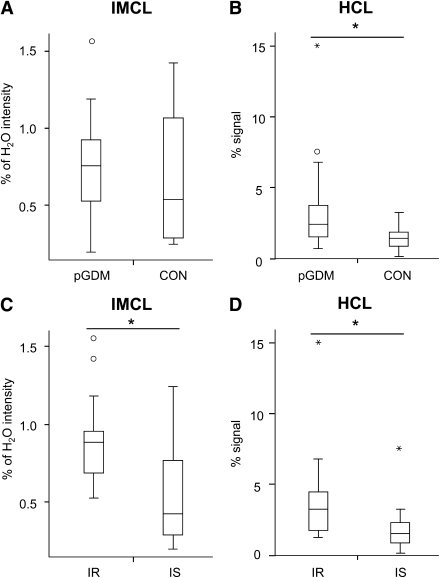
Objective: Ectopic lipid storage in muscle (intramyocellular lipids [IMCL]) and liver (hepatocellular lipids [HCL]) coexists with impaired myocellular flux through ATP synthase (fATPase) in certain cohorts with increased risk of type 2 diabetes. Because women with a history of gestational diabetes mellitus (pGDM) have elevated ectopic lipids and diabetes risk, we tested whether deteriorated energy metabolism contributes to these abnormalities.
Research design and methods: A total of 23 glucose-tolerant nonobese pGDM and eight women with normal glucose metabolism during pregnancy with similar age, body mass, and physical activity underwent oral glucose tolerance tests (OGTT) and intravenous glucose tolerance tests at 4-5 years after delivery. OGTT values <463 mL ⋅ min(-1) ⋅ m(-2) were considered to indicate insulin resistance. pGDM were further stratified into insulin-resistant (pGDM-IR) and insulin-sensitive (pGDM-IS) groups. IMCL, HCL, and fATPase were measured with (1)H/(31)P magnetic resonance spectroscopy.
Results: pGDM had 36% higher fat mass and 12% lower insulin sensitivity. Log-transformed fATPase was lower in pGDM (10.6 ± 3.8 µmol ⋅ mL muscle(-1) ⋅ min(-1) vs. 12.1 ± 1.4 µmol ⋅ mL muscle(-1) ⋅ min(-1), P < 0.03) and related to plasma adiponectin after adjustment for body fat (r = 0.44, P < 0.04). IMCL were 61% and 69% higher in pGDM-IR (P < 0.05 vs. pGDM-IS) and insulin resistant women (P < 0.003 vs. insulin sensitive), respectively. HCL were doubled (P < 0.05) in pGDM and insulin resistant women, and correlated positively with body fat mass (r = 0.50, P < 0.01) and inversely with insulin sensitivity (r = -0.46, P < 0.05).
Conclusions: Glucose-tolerant pGDM show increased liver fat but only slightly lower muscular insulin sensitivity and ATP synthesis. This suggests that alteration of hepatic lipid storage represents an early and predominant abnormality in this cohort.
Figures
References
-
- Szendroedi J, Roden M. Ectopic lipids and organ function. Curr Opin Lipidol 2009;20:50–56 - PubMed
-
- Trujillo ME, Scherer PE. Adipose tissue-derived factors: impact on health and disease. Endocr Rev 2006;27:762–778 - PubMed
-
- Thamer C, Machann J, Bachmann O, et al. Intramyocellular lipids: anthropometric determinants and relationships with maximal aerobic capacity and insulin sensitivity. J Clin Endocrinol Metab 2003;88:1785–1791 - PubMed
Publication types
MeSH terms
Substances
LinkOut - more resources
Full Text Sources
Medical
Miscellaneous
