. 2010 Nov;120(11):4040-54.
doi: 10.1172/JCI43025. Epub 2010 Oct 18.

Epithelial Notch signaling regulates interstitial fibrosis development in the kidneys of mice and humans

Affiliations

Epithelial Notch signaling regulates interstitial fibrosis development in the kidneys of mice and humans

Bernhard Bielesz et al. J Clin Invest. 2010 Nov.

Abstract

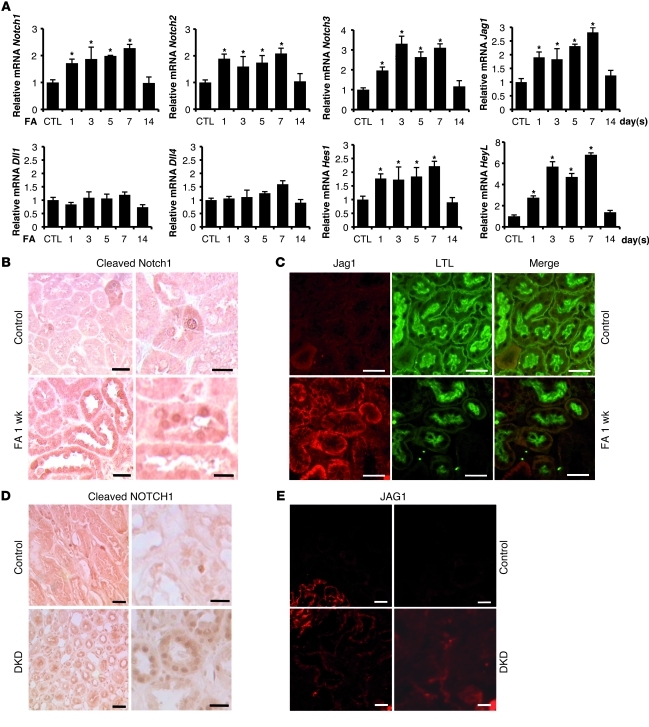
Chronic kidney disease is a leading cause of death in the United States. Tubulointerstitial fibrosis (TIF) is considered the final common pathway leading to end-stage renal disease (ESRD). Here, we used pharmacologic, genetic, in vivo, and in vitro experiments to show that activation of the Notch pathway in tubular epithelial cells (TECs) in patients and in mouse models of TIF plays a role in TIF development. Expression of Notch in renal TECs was found to be both necessary and sufficient for TIF development. Genetic deletion of the Notch pathway in TECs reduced renal fibrosis. Consistent with this, TEC-specific expression of active Notch1 caused rapid development of TIF. Pharmacologic inhibition of Notch activation using a γ-secretase inhibitor ameliorated TIF. In summary, our experiments establish that epithelial injury and Notch signaling play key roles in fibrosis development and indicate that Notch blockade may be a therapeutic strategy to reduce fibrosis and ESRD development.


Figures

Figure 1
Figure 1. Increased expression of Notch pathway in kidneys of mouse models of TIF and patients with TIF.
(A) Relative mRNA amount of Notch1, Notch2, Notch3, Jag1, Dll1, Dll4, Hes1, and HeyL determined by QRT-PCR in FA-injected (10-week-old male FvB) mice 1, 3, 5, 7, and 14 days following the injection. Kidneys were isolated individually from each animal sacrificed at different time points after FA injection (n > 3 per time point). Gene expression level was normalized to mRNA levels of control animals, and significance was calculated compared with controls. (B) Representative immunostaining images of cleaved Notch1–stained kidney sections of control and FA-injected mice. ICN1 expression in FA-treated kidneys increased compared with controls. (C) Double immunofluorescence analysis with Jag1 (Cy3, red) and Lotus Tetragonolobus lectin (LTL; FITC, green) of control and 1 week after FA treatment. Jag1 expression increased after FA injection compared with control animals. (D and E) Representative images of (D) cleaved NOTCH1 and (E) JAG1 immunostaining from a control healthy individual and from a patient with diabetic kidney disease (DKD) with marked TIF. *P < 0.05, Student’s t test with Bonferroni correction. Scale bars: 20 μm (B, left, and D, right), 10 μm (B, right), 50 μm (C, D, left, and E).
Figure 2
Figure 2. DBZ blocks Notch signaling without altering initial kidney injury and apoptosis.
(A) Relative mRNA amount (determined by QRT-PCR analysis) of Notch downstream effector genes Hes1 and HeyL in the kidneys of control and FA-injected mice in the presence or absence of DBZ. Male mice (10 weeks old) were injected with FA and DBZ (n = 4–7 per group per time point) and sacrificed on days 0, 1, 3, 5, and 7. (B) Serum creatinine levels of control and FA-injected animals in the presence or absence of DBZ. (C) Number of TUNEL-positive nuclei per 1,000 cells in the renal cortex of control and FA-injected mice in the absence or presence of DBZ. (D) QRT-PCR–based determination of Trp53, Bcl2, Apaf1, Bax, and Tgfb1 in kidneys of mice 1 day following FA injection. *P < 0.05.
Figure 3
Figure 3. Pharmacological inhibition of Notch signaling ameliorates FA-induced TIF.
(A) Relative mRNA amounts of Col1a1, Fn1, Vim, and Col3a1 in kidney samples of FA-injected mice in the presence or absence of DBZ. (B) Relative mRNA amount of Acta2, and representative Acta2 immunostaining images from the cortex and medulla of control mice and of mice 1 week after treatment with FA, in the presence or absence of DBZ. (C) Relative mRNA amounts of Cd68 and Emr1 in kidney samples of FA-injected mice. (D) Representative trichrome-stained kidney sections of control mice and of mice 1 week after treatment with FA, in the presence or absence of DBZ. Note the presence of tubular dilatation and substantial fibrosis (blue) in FA-injected animals. *P < 0.05. Scale bars: 50 μm (B and D).
Figure 4
Figure 4. Pharmacological inhibition of Notch signaling ameliorates UUO-induced TIF.
(A) Relative mRNA amount (determined by QRT-PCR analysis) of Notch1, Jag1, Hes1, and HeyL of sham- or UUO-operated mice (10-week-old male FvB; n = 5 per group) at 4, 6, 8, and 12 days following the UUO operation. (B) Representative images of PAS-stained kidney sections of the cortex and medulla from sham- or UUO-operated mice with or without DBZ treatment. (C) Relative mRNA amount (determined by QRT-PCR analysis) of HeyL, Col1a1, Fn1, and Acta2 in whole kidney homogenate isolated from sham- or UUO-operated mice with or without DBZ treatment on day 8. *P < 0.05 versus control (unless otherwise indicated), Student’s t test with Bonferroni correction. Scale bars: 50 μm (B).
Figure 5
Figure 5. Diminished TIF following FA injection in tubule-specific Rbpj knockout mice.
(A) Decreased mRNA levels of Rbpj and HeyL in PEPCKCreRbpjfl/fl mice. Male 10-week-old control (WT and Rbpjfl/fl) and PEPCKCreRbpjfl/fl littermates were injected with sham or FA, and relative mRNA expression was determined in whole kidney lysates 7 days later. (B) Representative images of PAS-stained kidney sections from control (WT and Rbpjfl/fl) and PEPCKCreRbpjfl/fl mice with or without FA injection. (C) Relative mRNA amount of Col1a1, Vim, and Acta2 in control and PEPCKCreRbpjfl/fl mice with or without FA injection. *P < 0.05, Student’s t test with Bonferroni correction. Scale bars: 50 μm (B).
Figure 6
Figure 6. Transgenic expression of ICNotch1 in TECs causes severe kidney fibrosis.
(A) Relative mRNA amount of Notch targets Hes1, Hey1, and HeyL and (C) Fn1, Col1a1, Col3a1, Col4a1, Vim, Acta2, Cd68, and Emr1 in doxycycline-fed wild-type and single-transgenic controls and double-transgenic Pax8rtTA/ICNotch1 animals. Relative mRNA amount was normalized to the expression levels in control animals. (B) Representative images of PAS-stained kidney sections from wild-type and single-transgenic control and double-transgenic Pax8rtTA/ICNotch1 animals. Male littermates were placed on doxycycline containing food at 4 weeks of age and sacrificed at 8 weeks of age (n > 5 per group). Scale bars: 100 μm (B, top), 50 μm (B, middle and bottom).
Figure 7
Figure 7. TGF-β1 activates Notch signaling, and Notch plays a role in EMT of cultured TECs.
(A) Relative mRNA amount of Jag1 in TGF-β1–treated (5 ng/ml) NRK cells in the presence or absence of DBZ (1 μM). Western blot analysis of cleaved Notch1, Jag1, Acta2, and Actb following incubation of NRK cells with TGF-β1 in the presence or absence of DBZ is also shown. (B) Relative mRNA amount of Acta2, Cdh1, Vim, Col1a1, Snai1, and Snai2 of NRK cells treated with TGF-β1 in the presence or absence of DBZ. (CE) NRK cells infected with ICN1, ICN2, or BMZ/EGFP retrovirus and treated with sham or tamoxifen (Tam; 1.5 μM). (C) Relative amounts of Notch1, Notch2, Hey1, and HeyL mRNA. (D) Relative amounts of Fn1, Col1a1, Vim, Acta2, Snai1, and Snai2 mRNA. (E) Western blot of Acta2, Snai1, Snai2, Actb, Trp53, Parp1, and cleaved caspase 3. Lysates were prepared 48 hours after treatment with 1.5 μM tamoxifen or sham. All experiments were repeated at least 3 times; data represent 1 of the 3 repeats. *P < 0.05, Student’s t test with Bonferroni correction.
Figure 8
Figure 8. In vivo expression of Notch does not correlate with markers of EMT.
(A) Relative mRNA amount of Cdh1, Cdh2, Cdh6, Cdh16, Snai1, and Snai2 in wild-type and single-transgenic control and double-transgenic Pax8rtTA/ICNotch1 animals. Relative mRNA amount was normalized to control expression. Representative immunostaining images of Cdh1 of control and Pax8rtTA/ICNotch1 animals are also shown. (B) Relative mRNA amount of Snai1, Snai2, and Twist1 in kidney samples of FA-injected mice in the presence or absence of DBZ. (C) Relative mRNA amount of Cdh1 and representative immunostaining images of Cdh1 of control (day 0) mice and FA-treated mice in the presence or absence of DBZ. (D) Relative mRNA amount of Cdh6, Cdh16, and Tjp1 in kidney samples of FA-injected mice in the presence or absence of DBZ. (E) Relative mRNA amount of Snai1, Snai2, Twist1, and Foxc2 and (F) Cdh1, Tjp1, and S100a4 in control animals and the UUO-induced TIF model in the presence or absence of DBZ. *P < 0.05, Student’s t test with Bonferroni correction. Scale bars: 50 μm (A and C).
Figure 9
Figure 9. TEC expression of Notch induces cell proliferation in vivo and in vitro.
(A) Double-immunostaining images of cleaved Notch1 (green) and PCNA (red) of doxycycline-fed male wild-type and single-transgenic control and double-transgenic Pax8rtTA/ICNotch1 animals. (B) Relative mRNA amount of Ccnb1, Ccnd1, Ccnd2, and Ccne1 in doxycycline fed male wild-type and single-transgenic control and double-transgenic Pax8rtTA/ICNotch1 animals. (C) Increased proliferation rate of cultured NRK cells following ICN1 or ICN2 expression. NRK cells were infected with ICN1, ICN2, or BMZ/EGFP retrovirus and treated with sham or tamoxifen (0.75–3 μM). Proliferation was measured by BrdU assay per the manufacturer’s instructions. (D) Relative mRNA amount of Ccna1, Ccnd1, and Ccne1 in control, EGFP-, ICN1-, and ICN2-infected cells. (E) Western blot analysis of Ccnd1 and Actb expression in EGFP-, ICN1-, and ICN2- infected cells. Scale bars: 50 μm (A).
Figure 10
Figure 10. TEC expression of Notch correlates with cell proliferation in vivo in mice and humans.
(A) Number of PCNA-positive nuclei counted per low-power field of FA-injected animals in the presence or absence of DBZ at 0, 1, 3, 5, and 7 days following FA administration. PCNA immunostaining of kidneys from controls and FA-injected animals in the presence or absence of DBZ is also shown. Data are presented from n = 2–12 fields per mouse per group. (B) Relative mRNA amount of Ccnd2, Ccne1, and Ccnb1 in kidneys of controls and FA-injected mice in the presence or absence of DBZ at 1, 3, 5, and 7 days following FA injection. (C) Double-immunostaining images of cleaved Notch1 (green) and PCNA (red) from kidney samples of healthy control and diseased (diabetic kidney disease with marked TIF) human subjects. *P < 0.05, Student’s t test with Bonferroni correction. Scale bars: 50 μm (A and C).

References

    1. Centers for Disease Control and Prevention (CDC). State-specific trends in chronic kidney failure--United States, 1990–2001. MMWR Morb Mortal Wkly Rep. 2004;53(39):918–920. - PubMed
    1. Nath KA. Tubulointerstitial changes as a major determinant in the progression of renal damage. Am J Kidney Dis. 1992;20(1):1–17. - PubMed
    1. Kriz W, et al. How does podocyte damage result in tubular damage? Kidney Blood Press Res. 1999;22(1–2):26–36. - PubMed
    1. Golestaneh L, Melamed ML, Hostetter TH. Uremic memory: the role of acute kidney injury in long-term outcomes. Kidney Int. 2009;76(8):813–814. doi: 10.1038/ki.2009.314. - DOI - PubMed
    1. Kalluri R, Neilson EG. Epithelial-mesenchymal transition and its implications for fibrosis. J Clin Invest. 2003;112(12):1776–1784. - PMC - PubMed

Publication types

MeSH terms