Review
. 2010 Nov;5(6):473-9.
doi: 10.1097/COH.0b013e32833ed742.

Analysis of biomarker data: logs, odds ratios, and receiver operating characteristic curves

Affiliations
Review

Analysis of biomarker data: logs, odds ratios, and receiver operating characteristic curves

Birgit Grund et al. Curr Opin HIV AIDS. 2010 Nov.

Abstract

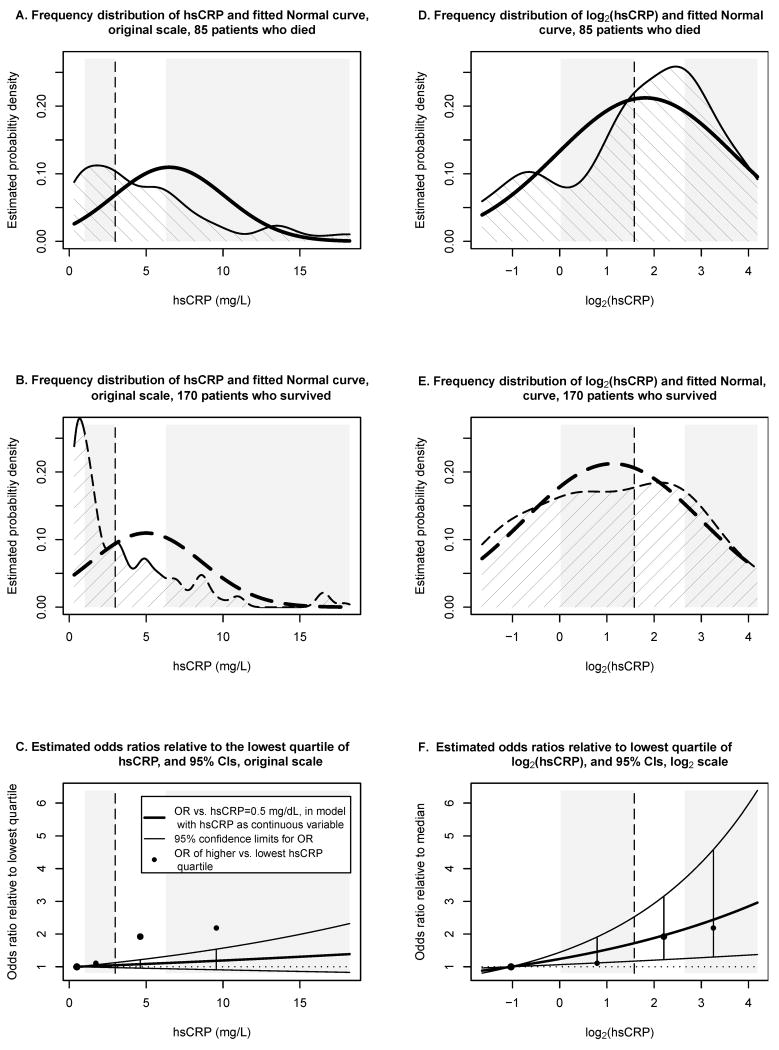
Purpose of review: We discuss two data analysis issues for studies that use binary clinical outcomes (whether or not an event occurred): the choice of an appropriate scale and transformation when biomarkers are evaluated as explanatory factors in logistic regression and assessing the ability of biomarkers to improve prediction accuracy for event risk.

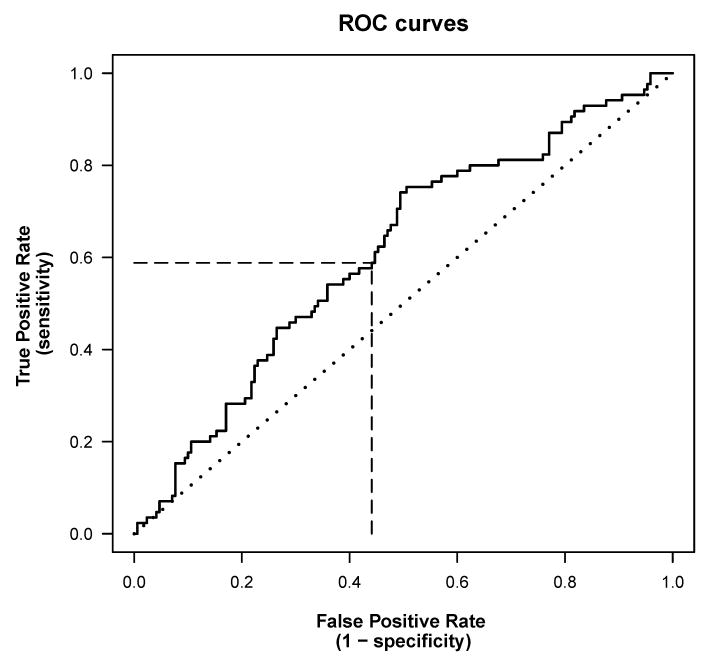
Recent findings: Biomarkers with skewed distributions should be transformed before they are included as continuous covariates in logistic regression models. The utility of new biomarkers may be assessed by measuring the improvement in predicting event risk after adding the biomarkers to an existing model. The area under the receiver operating characteristic (ROC) curve (C-statistic) is often cited; it was developed for a different purpose, however, and may not address the clinically relevant questions. Measures of risk reclassification and risk prediction accuracy may be more appropriate.

Summary: The appropriate analysis of biomarkers depends on the research question. Odds ratios obtained from logistic regression describe associations of biomarkers with clinical events; failure to accurately transform the markers, however, may result in misleading estimates. Although the C-statistic is often used to assess the ability of new biomarkers to improve the prediction of event risk, other measures may be more suitable.


Figures

Figure 1
Figure 1. Distributions of hsCRP and log2(hsCRP), and estimated odds ratios in a case-control study.[1]
Panel A shows the frequency distribution of hsCRP for 85 participants who died, panel B the distribution of hsCRP for 170 participants who survived. Bold lines show the fitted Normal curves. The dashed vertical line marks the median hsCRP for all 255 participants, white and gray rectangles mark the four hsCRP quartiles. HsCRP ranged from 0.2 to 82.7 mg/L; the lowest and highest 5% were not displayed, but included in the analyses. Panel C shows odds ratios estimates (bold solid line) and 95% confidence limits (lighter lines above and below) obtained in a logistic regression model with continuous hsCRP; odds ratios are relative to hsCRP=0.5 mg/L, the median of the lowest hsCRP quartile. Circles mark direct odds ratio estimates comparing higher hsCRP quartiles to the lowest quartile. Confidence intervals do not contain the direct estimates, which indicates poor model fit for the logistic regression with continuous hsCRP. Panels D-F shows the corresponding analyses for log2(hsCRP); distributions of log2(hsCRP) are closer to Normal. The direct estimates are closer to the 95% confidence intervals by logistic regression, indicating better model fit and more reliable inference when analyzing hsCRP on the log2 scale. Abbreviations: hsCRP, highly sensitive C-reactive protein
Figure 2
Figure 2. Receiver operating characteristic (ROC) curves
The solid line shows an estimated ROC curve for the univariate prediction rule “predict death if baseline hsCRP > c”, calculated for data from a case-control study with 255 participants [1]; higher hsCRP was associated with a higher risk of death. The threshold c determines both the true prediction rate (TPR) and false prediction rate (FPR), and the estimated ROC curve plots the TPR versus the FPR for all possible values of c. When the threshold is at the median hsCRP, c=3.0 mg/L, the TPR is 0.59 and the FPR is 0.44 (dashed lines); this means, 59% of cases and 56% of controls are classified correctly. The C-statistic is the area under the ROC curve. The diagonal dotted line represents the ROC curve for random guessing. Abbreviations: FPR, false prediction rate; hsCRP, highly sensitive C-reactive protein; ROC, receiver operating characteristic; TPR, true prediction rate

References

    1. Kuller LH, Tracy R, Belloso W, et al. Inflammatory and coagulation biomarkers and mortality in patients with HIV infection. PLoS Med. 2008;5(10):e203. - PMC - PubMed
    1. Mocroft A, Wyatt C, Szczech L, et al. Interruption of antiretroviral therapy is associated with increased plasma cystatin C. AIDS. 2009;23:71–82. - PMC - PubMed
    1. Neuhaus J, Jacobs J, Baker J, et al. Markers of inflammation, coagulation and renal function are elevated in adults with HIV infection. J Infect Dis. 2010;201(12):1788–95. - PMC - PubMed
    1. Rodger A, Fox Z, Lundgren JD, et al. Activation and coagulation biomarkers are independent predictors of the development of opportunistic disease in patients with HIV infection. J Infect Dis. 2009;200(6):973–83. - PMC - PubMed
    1. Kay R, Little S. Transformations of the explanatory variables in the logistic regression model for binary data. Biometrika. 1987;74(3):495–501.

Publication types