. 2010 Oct 27;12(1):60.
doi: 10.1186/1532-429X-12-60.

Elasticity-based determination of isovolumetric phases in the human heart

Affiliations

Elasticity-based determination of isovolumetric phases in the human heart

Thomas Elgeti et al. J Cardiovasc Magn Reson. .

Abstract

BACKGROUND/MOTIVATION: To directly determine isovolumetric cardiac time intervals by magnetic resonance elastography (MRE) using the magnitude of the complex signal for deducing morphological information combined with the phase of the complex signal for tension-relaxation measurements.

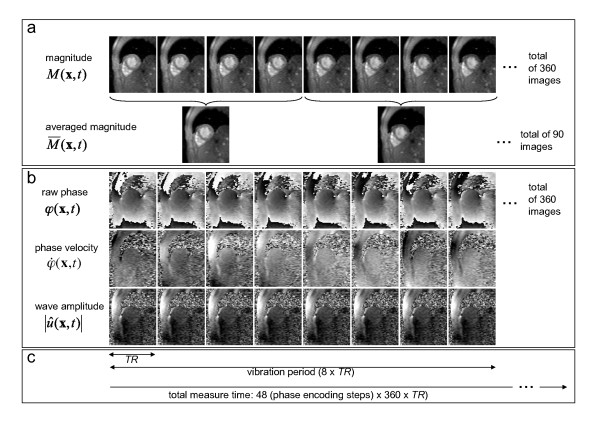
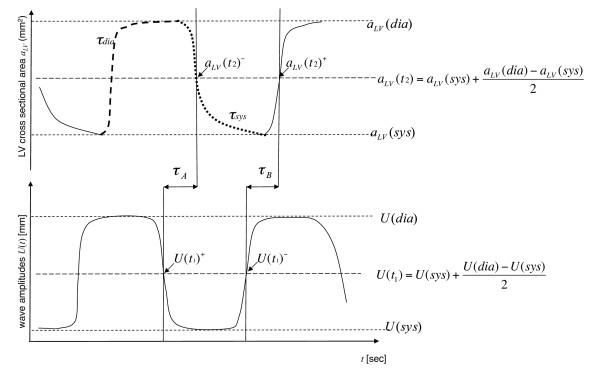
Methods: Thirty-five healthy volunteers and 11 patients with relaxation abnormalities were subjected to transthoracic wave stimulation using vibrations of approximately 25 Hz. A k-space-segmented, ECG-gated gradient-recalled echo steady-state sequence with a 500-Hz bipolar motion-encoding gradient was used for acquiring a series of 360 complex images of a short-axis view of the heart at a frame rate of less than 5.2 ms. Magnitude images were employed for measuring the cross-sectional area of the left ventricle, while phase images were used for analyzing the amplitudes of the externally induced waves. The delay between the decrease in amplitude and onset of ventricular contraction was determined in all subjects and assigned to the time of isovolumetric tension. Conversely, the delay between the increase in wave amplitude and ventricular dilatation was used for measuring the time of isovolumetric elasticity relaxation.

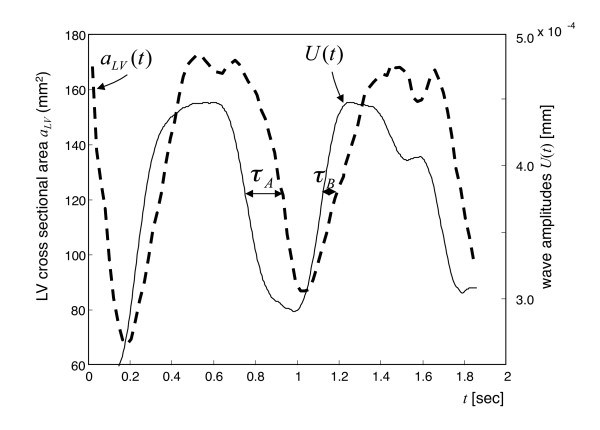
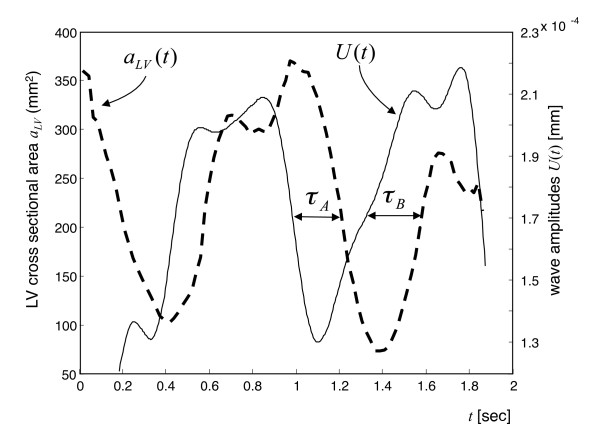
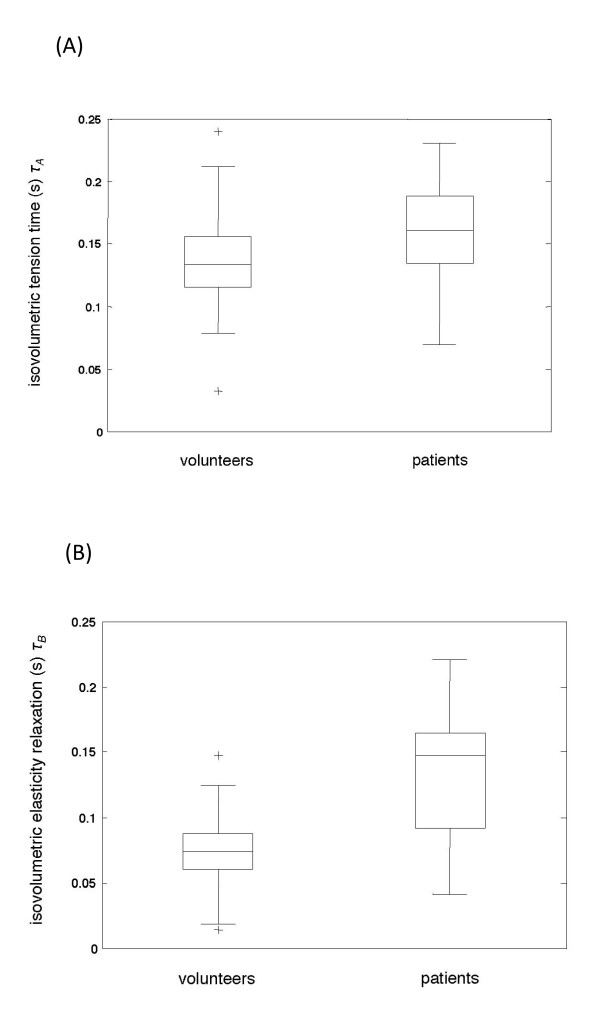
Results: Wave amplitudes decreased during systole and increased during diastole. The variation in wave amplitude occurred ahead of morphological changes. In healthy volunteers the time of isovolumetric elasticity relaxation was 75 ± 31 ms, which is significantly shorter than the time of isovolumetric tension of 136 ± 36 ms (P < 0.01). In patients with relaxation abnormalities (mild diastolic dysfunction, n = 11) isovolumetric elasticity relaxation was significantly prolonged, with 133 ± 57 ms (P < 0.01), whereas isovolumetric tension time was in the range of healthy controls (161 ± 45 ms; P = 0.053).

Conclusion: The complex MRE signal conveys complementary information on cardiac morphology and elasticity, which can be combined for directly measuring isovolumetric tension and elasticity relaxation in the human heart.


Figures

Figure 1
Figure 1
Diagram for evaluating the complex MRE signal and deducing morphological changes as well as variations in myocardial elasticity during the cardiac cycle. a: Ninety images M¯(t) were obtained from 360 magnitude images M(t) by temporal averaging and used for segmenting the left ventricular cross-sectional area (αLV). b: Three major steps for calculating wave amplitudes U(t) from 360 raw phase images φ(x,t) as described in the text. i) unwrapping, ii) integration, iii) Hilbert transform and display as magnitude U(t). c: Timing of the image acquisition relative to a vibration period (see text for further details).
Figure 2
Figure 2
Diagram displaying the measurements obtained from the left ventricular cross-sectional area (αLV) time curve on the top: i) duration of diastole (τdia = dashed), ii) duration of systole (τsys = dotted), iii) diastolic left ventricular cross-sectional area, αLV(dia), and iv) systolic left ventricular cross-sectional area, αLV(sys), and v) the resulting αLV(t2)- on the descending systolic branch, and vi) αLV(t2)+ on the ascending diastolic branch of the left ventricular cross-sectional area time curve. On the bottom of the figure the measurements for the wave amplitude time curve are displayed: i) diastolic level of the wave amplitude U(dia), ii) systolic level of the wave amplitude U(sys), and the resulting iii) U(t1)- on the descending branch and iv) U(t1)+ on the ascending branch of the wave amplitude time curve. Isovolumetric tension time τA and isovolumetric elasticity relaxation τB are shown in the middle.
Figure 3
Figure 3
Changes in wave amplitude U(t) and LV cross-sectional areas αLV(t) in a healthy volunteer. Cardiac intervals of isovolumetric tension (τA) and isovolumetric elasticity relaxation (τB) are indicated. For further details, see text. Changes in wave amplitude U(t) and LV cross-sectional areas αLV(t) in a healthy volunteer. Cardiac intervals of isovolumetric tension (τA) and isovolumetric elasticity relaxation (τB) are indicated. For further details, see text.
Figure 4
Figure 4
Changes in wave amplitude U(t) and LV cross-sectional areas αLV(t) in a patient with LV relaxation abnormalities. The isovolumetric tension time (τA) is in the range of values measured in healthy volunteers. In contrast, the time of isovolumetric elasticity relaxation (τB) was significantly increased in patients. Further explanations are given in the caption to Figure 4. Changes in wave amplitude U(t) and LV cross-sectional areas αLV(t) in a patient with LV relaxation abnormalities. The isovolumetric tension time (τA) is in the range of values measured in healthy volunteers. In contrast, the time of isovolumetric elasticity relaxation (τB) was significantly increased in patients. Further explanations are given in the caption to Figure 4.
Figure 5
Figure 5
a: Boxplot of the isovolumetric tension times (τA) in volunteers and in patients with mild diastolic dysfunction. The mean, the lower and upper quartiles, as well as the 50th percentile (median) are displayed. The full data range is represented by the whiskers and two outliers in the volunteer group. No significant difference between the two groups can be found (mean τA in volunteers = 136 ± 36 versus 161 ± 46 ms in patients). a: Boxplot of the isovolumetric tension times (τA) in volunteers and in patients with mild diastolic dysfunction. The mean, the lower and upper quartiles, as well as the 50th percentile (median) are displayed. The full data range is represented by the whiskers and two outliers in the volunteer group. No significant difference between the two groups can be found (mean τA in volunteers = 136 ± 36 versus 161 ± 46 ms in patients). b: Boxplot of the isovolumetric elasticity relaxation (τB) in volunteers and in patients with mild diastolic dysfunction. The mean, the lower and upper quartiles, as well as the 50th percentile (median) are displayed. The full data range is represented by the whiskers and two outliers in the volunteer group. There are significant differences between mean τB in volunteers (75 ± 31 ms) and that in patients (133 ± 58 ms).

References

    1. Tei C, Ling LH, Hodge DO, Bailey KR, Oh JK, Rodeheffer RJ, Tajik AJ, Seward JB. New index of combined systolic and diastolic myocardial performance: a simple and reproducible measure of cardiac function--a study in normals and dilated cardiomyopathy. J Cardiol. 1995;26:357–366. - PubMed
    1. Cui W, Roberson DA, Chen Z, Madronero LF, Cuneo BF. Systolic and diastolic time intervals measured from Doppler tissue imaging: normal values and Z-score tables, and effects of age, heart rate, and body surface area. J Am Soc Echocardiogr. 2008;21:361–370. doi: 10.1016/j.echo.2007.05.034. - DOI - PubMed
    1. Rump J, Klatt D, Braun J, Warmuth C, Sack I. Fractional encoding of harmonic motions in MR elastography. Magn Reson Med. 2007;57:388–395. doi: 10.1002/mrm.21152. - DOI - PubMed
    1. Sack I, Rump J, Elgeti T, Samani A, Braun J. MR elastography of the human heart: noninvasive assessment of myocardial elasticity changes by shear wave amplitude variations. Magn Reson Med. 2009;61:668–677. doi: 10.1002/mrm.21878. - DOI - PubMed
    1. Kolipaka A, Mcgee KP, Araoz PA, Glaser KJ, Manduca A, Romano AJ, Ehman RL. MR elastography as a method for the assessment of myocardial stiffness: comparison with an established pressure-volume model in a left ventricular model of the heart. Magn Reson Med. 2009;62:135–140. doi: 10.1002/mrm.21991. - DOI - PMC - PubMed