. 2010 Oct 28:9:124.
doi: 10.1186/1476-511X-9-124.

Heme oxygenase-1 prevents non-alcoholic steatohepatitis through suppressing hepatocyte apoptosis in mice

Affiliations

Heme oxygenase-1 prevents non-alcoholic steatohepatitis through suppressing hepatocyte apoptosis in mice

YueMin Nan et al. Lipids Health Dis. .

Abstract

Objective: Heme oxygenase-1 (HO-1), the rate-limiting enzyme in heme catabolism, has been reported to have potential antioxidant properties. However, the role of HO-1 on hepatocyte apoptosis remains unclear. We aim to elucidate the effects of HO-1 on oxidative stress related hepatocellular apoptosis in nutritional steatohepatitis in mice.

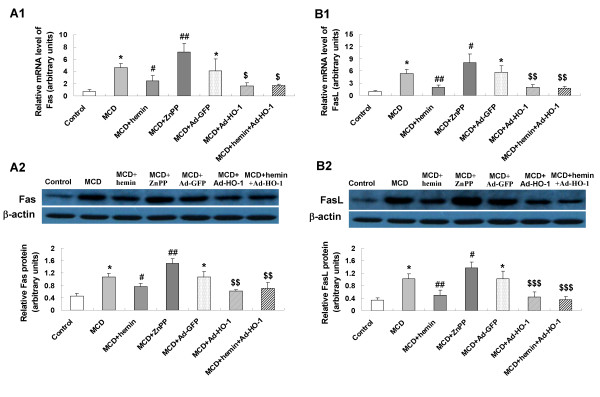
Methods: C57BL/6J mice were fed with methionine-choline deficient (MCD) diet for four weeks to induce hepatic steatohepatitis. HO-1 chemical inducer (hemin), HO-1 chemical inhibitor zinc protoporphyrin IX (ZnPP-IX) and/or adenovirus carrying HO-1 gene (Ad-HO-1) were administered to mice, respectively. Hepatocyte apoptosis was evaluated by terminal deoxynucleotidyl transferase dUTP nick-end labeling (TUNEL) assay, the mRNA and protein expression of apoptosis related genes were assayed by quantitative real-time PCR and Western blot.

Results: Hepatocyte signs of oxidative related apoptotic injury were presented in mice fed with MCD diet for 4 weeks. Induction of HO-1 by hemin or Ad-HO-1 significantly attenuated the severity of liver histology, which was associated with decreased hepatic lipid peroxidation content, reduced number of apoptotic cells by TUNEL staining, down-regulated expression of pro-apoptosis related genes including Fas/FasL, Bax, caspase-3 and caspase-9, reduced expression of cytochrome p4502E1 (CYP2E1), inhibited cytochrome c (Cyt-c) release, and up-regulated expression of anti-apoptosis gene Bcl-2. Whereas, inhibition of HO-1 by ZnPP-IX caused oxidative stress related hepatic injury, which concomitant with increased number of TUNEL positive cells and up-regulated expression of pro-apoptosis related genes.

Conclusions: The present study provided evidences for the protective role of HO-1 in preventing nutritional steatohepatitis through suppressing hepatocyte apoptosis in mice.


Figures

Figure 1
Figure 1
Effect of HO-1 on hepatocyte apoptosis in mice fed with MCD diet at four weeks. (A) TUNEL staining for hepatocyte apoptosis in liver sections from mice administrated: control diet; MCD diet; MCD diet treated with hemin, ZnPP-IX, Ad-GFP, Ad-HO-1 and combination of Ad-HO-1 and hemin, respectively. (original magnification, × 400). (B) Quantitation of mean TUNEL-positive cells/field. are expressed as mean ± SD. *P < 0.01 compared with control; #P < 0.05, ##P < 0.01, compared with MCD feeding mice; $P < 0.01, compared with MCD+Ad-GFP treated mice. Slides are representative of 6 animals per group.
Figure 2
Figure 2
Effects of the MCD diet and treatment with hemin and/or Ad-HO-1 or ZnPP-IX on hepatic lipoperoxide content measured as thiobarbituric acid-reactive substrances (TBARS). Data are expressed as mean ± SD (n = 6 per group). *P < 0.01, **P < 0.001, compared with control; #P < 0.05, ##P < 0.01, compared with MCD feeding mice; $P < 0.05, $$P < 0.01, compared with MCD+ Ad-GFP treated mice.
Figure 3
Figure 3
Effects of hemin and/or Ad-HO-1 on hepatic HO-1 protein expression in the liver of mice. (A) Immunostaining for HO-1 protein. (B) Effect of hemin and/or Ad-HO-1 on quantitative protein expression of HO-1. The expression of HO-1 was estimated by average area density (areas of positive cells/total areas) (original magnification, × 200). Data are expressed as the mean ± SD (n = 6 per group). *P < 0.001, compared with control; #P < 0.01, compared with MCD feeding mice; $P < 0.01, compared with MCD+ Ad-GFP treated mice.
Figure 4
Figure 4
Effects of HO-1 on hepatic expression of cytochrome p450 2E1 (CYP2E1) (A) and cytochrome c (Cyt-c) (B). mRNA expression of CYP2E1 (A1) and Cyt-c mRNA(B1) was examined by real-time quantitative PCR; and protein expression of CYP2E1 (A2) and Cyt-c (B2) were measured by Western blot. Data are expressed as the mean ± SD (n = 6 per group). *P < 0.001, compared with control mice; #P < 0.05, ##P < 0.01, ###P < 0.001, compared with MCD mice; $P < 0.05, $$P < 0.01, compared with MCD+ Ad-GFP treated mice.
Figure 5
Figure 5
Effects of HO-1 on expression of FAS and FASL in the liver of mice. mRNA expression of Fas (A1) and Fasligand (FasL) (B1) was examined by real-time PCR; protein expression of Fas (A2) and FasL (B2) were measured by Western blot. Data are expressed as the mean ± SD (n = 6 per group). *P < 0.001, compared with control mice; #P < 0.05, ##P < 0.01, compared with MCD mice; $P < 0.05, $$P < 0.01, $$$P < 0.01, compared with MCD+ Ad-GFP treated mice.
Figure 6
Figure 6
Effects of HO-1 on expression of caspase 3 and casepase 9 in the liver of mice. mRNA expression of casepase 3 (A1) and casepase 9 (B1) was examined by real-time PCR; protein expression of casepase 3 (A2) and casepase 9 (B2) were measured by Western blot. Data are expressed as the mean ± SD (n = 6 per group). *P < 0.01, ** P < 0.001 compared with control mice; #P < 0.05, ##P < 0.01, ###P < 0.01, compared with MCD mice; $P < 0.05, $$P < 0.01, $$$P < 0.01, compared with MCD+ Ad-GFP treated mice.
Figure 7
Figure 7
Effects of HO-1 on expression of Bax and Bcl-2 in the liver of mice. mRNA expression of Bax (A1) and Bcl-2 (B1) was examined by real-time PCR; protein expression of Bax (A2) and Bcl-2 (B2) were measured by Western blot. Data are expressed as the mean ± SD (n = 6 per group). *P < 0.01, ** P < 0.001 compared with control mice; #P < 0.01, ##P < 0.01, compared with MCD mice; $P < 0.05, $$P < 0.01, compared with MCD+ Ad-GFP treated mice.

Similar articles

Cited by

References

    1. Canbay A, Gieseler RK, Gores GJ, Gerken G. The relationship between apoptosis and non-alcoholic fatty liver disease: an evolutionary cornerstone turned pathogenic. Z Gastroenterol. 2005;43:211–217. doi: 10.1055/s-2004-813744. - DOI - PubMed
    1. Jarrar MH, Baranova A, Collantes R, Ranard B, Stepanova M, Bennett C, Fang Y, Elariny H, Goodman Z, Chandhoke V, Younossi ZM. Adipokines and cytokines in non-alcoholic fatty liver disease. Aliment Pharmacol Ther. 2008;27:412–421. doi: 10.1111/j.1365-2036.2007.03586.x. - DOI - PubMed
    1. Jou J, Choi SS, Diehl AM. Mechanisms of disease progression in nonalcoholic fatty liver disease. Semin Liver Dis. 2008;28:370–379. doi: 10.1055/s-0028-1091981. - DOI - PubMed
    1. Edmison J, McCullough AJ. Pathogenesis of non-alcoholic steatohepatitis: human data. Clin Liver Dis. 2007;11:75–104. doi: 10.1016/j.cld.2007.02.011. - DOI - PubMed
    1. Mantena SK, King AL, Andringa KK, Eccleston HB, Bailey SM. Mitochondrial dysfunction and oxidative stress in the pathogenesis of alcohol- and obesity-induced fatty liver diseases. Free Radic Biol Med. 2008;44:1259–1272. doi: 10.1016/j.freeradbiomed.2007.12.029. - DOI - PMC - PubMed

Publication types