. 2011 Jan 14;286(2):929-41.
doi: 10.1074/jbc.M110.162131. Epub 2010 Oct 27.

STAT1 is a master regulator of pancreatic {beta}-cell apoptosis and islet inflammation

Affiliations

STAT1 is a master regulator of pancreatic {beta}-cell apoptosis and islet inflammation

Fabrice Moore et al. J Biol Chem. .

Abstract

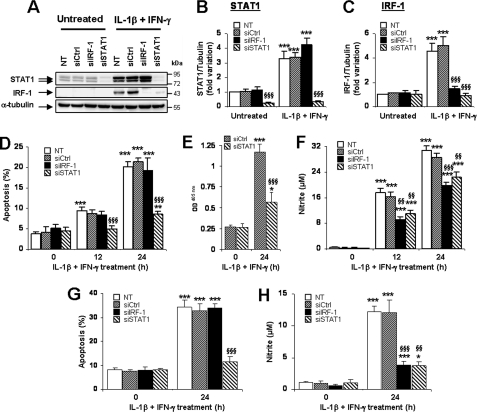
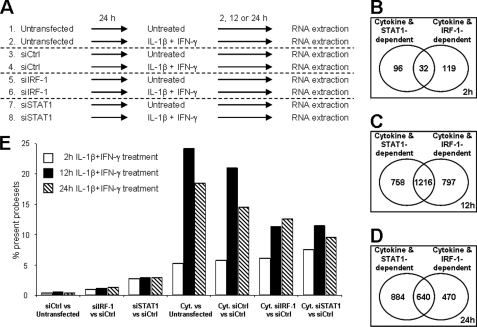
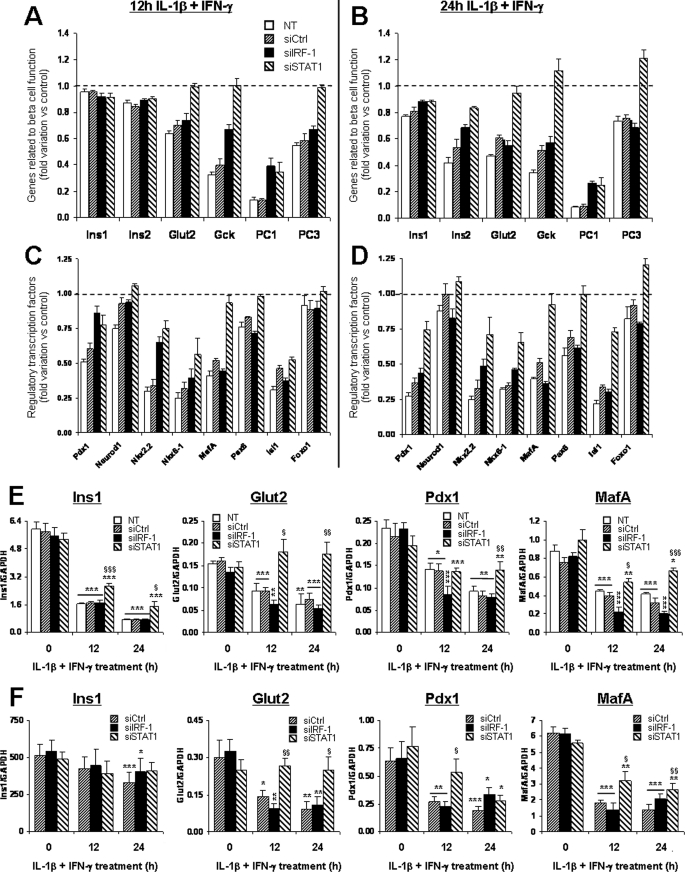
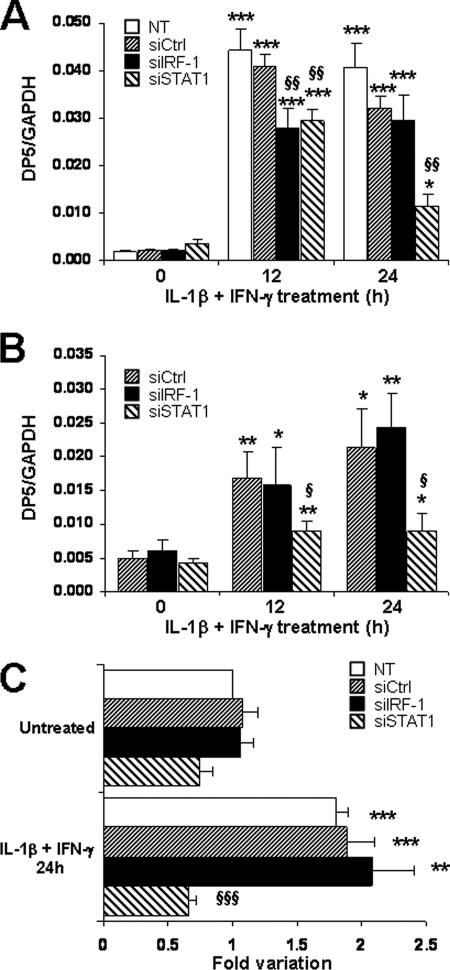
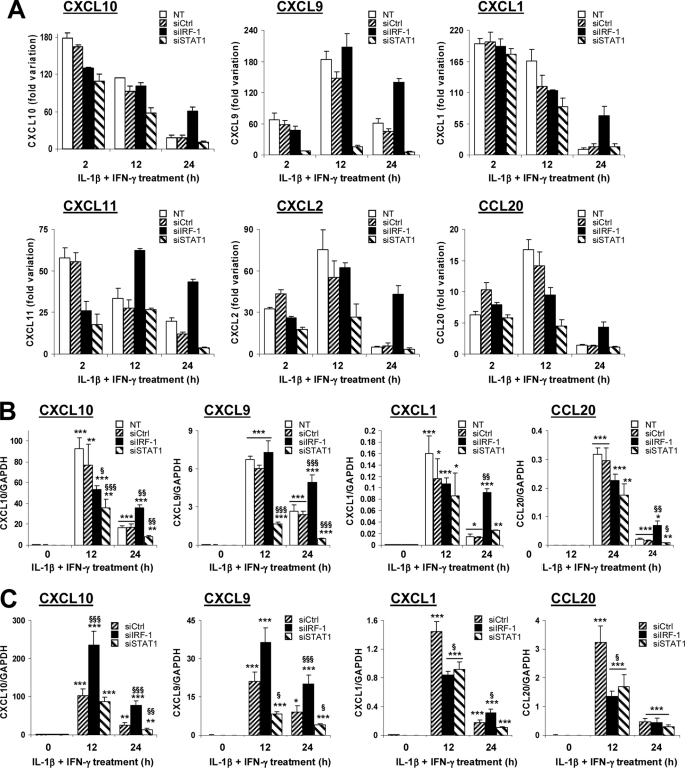
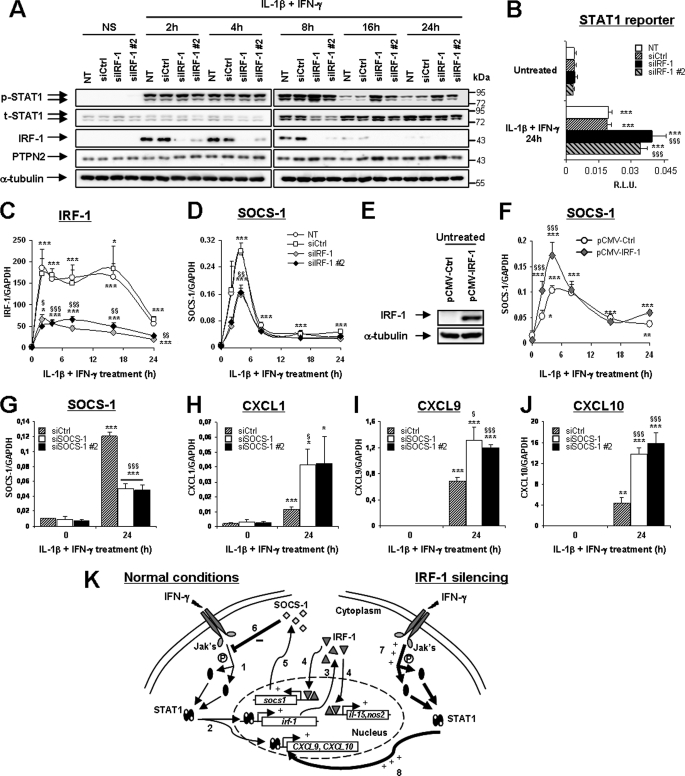
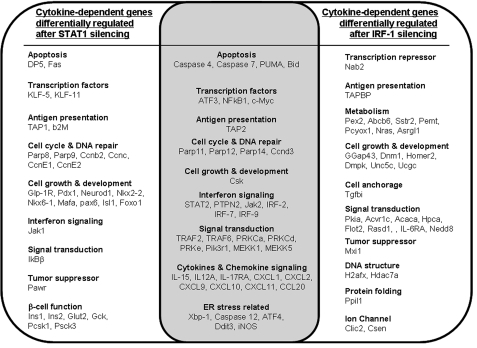
Cytokines produced by islet-infiltrating immune cells induce β-cell apoptosis in type 1 diabetes. The IFN-γ-regulated transcription factors STAT1/IRF-1 have apparently divergent effects on β-cells. Thus, STAT1 promotes apoptosis and inflammation, whereas IRF-1 down-regulates inflammatory mediators. To understand the molecular basis for these differential outcomes within a single signal transduction pathway, we presently characterized the gene networks regulated by STAT1 and IRF-1 in β-cells. This was done by using siRNA approaches coupled to microarray analysis of insulin-producing cells exposed or not to IL-1β and IFN-γ. Relevant microarray findings were further studied in INS-1E cells and primary rat β-cells. STAT1, but not IRF-1, mediates the cytokine-induced loss of the differentiated β-cell phenotype, as indicated by decreased insulin, Pdx1, MafA, and Glut2. Furthermore, STAT1 regulates cytokine-induced apoptosis via up-regulation of the proapoptotic protein DP5. STAT1 and IRF-1 have opposite effects on cytokine-induced chemokine production, with IRF-1 exerting negative feedback inhibition on STAT1 and downstream chemokine expression. The present study elucidates the transcriptional networks through which the IFN-γ/STAT1/IRF-1 axis controls β-cell function/differentiation, demise, and islet inflammation.


Figures

FIGURE 1.
FIGURE 1.
siRNA-mediated STAT1 knockdown protects INS-1E and primary rat β-cells against cytokine-induced apoptosis. A–F, insulin-producing INS-1E cells were left untransfected (NT), or transfected with 30 nm si-control, siIRF-1, or siSTAT1. After 24 h of recovery, cells were left untreated or exposed to 10 units/ml IL-1β and 100 units/ml IFN-γ for 12 or 24 h as indicated. A, STAT1, IRF-1, and α-tubulin protein expression were evaluated by Western blot. B and C, mean optical density measurements of STAT1 and IRF-1 Western blots corrected for protein loading by α-tubulin. Results are mean fold variation ± S.E. of five independent experiments. D and E, apoptosis was evaluated using Hoechst 33342/propidium iodide staining (D) and a Cell Death Detection ELISAPLUS kit (E). F, nitrite concentrations in supernatants were evaluated as described under “Experimental Procedures.” Results are mean ± S.E. of five independent experiments. G and H, primary FACS-sorted rat β-cells were cultured for 2 days and then left untransfected or transfected with 30 nm of si-control, siIRF-1, or siSTAT1 as indicated. After 24 h of recovery, cells were left untreated or exposed to 10 units/ml IL-1β and 100 units/ml IFN-γ for 24 h as indicated. G, apoptosis was evaluated using Hoechst 33342/propidium iodide staining. H, nitrite concentrations in supernatants. Results are mean ± S.E. of five independent experiments. *, p < 0.05; **, p < 0.01; and ***, p < 0.001 versus untreated (i.e. not treated with cytokines) or untreated transfected with the same siRNA. §§, p < 0.01 and §§§, p < 0.001 versus untransfected and si-control treated with cytokines at the same time point, ANOVA followed by Student's t test with Bonferroni correction.
FIGURE 2.
FIGURE 2.
Analysis of gene networks regulated by cytokines, IRF-1, and STAT1 in INS-1E cells. INS-1E cells were left untransfected or transfected with 30 nm of si-control, siIRF-1, or siSTAT1 as described in the legend to Fig. 1. After 24 h of recovery, cells were left untreated or exposed to 10 units/ml IL-1β and 100 units/ml IFN-γ for 2, 12, or 24 h as indicated, before being harvested for RNA extraction and array analysis. A, schematic representation of the microarray conditions (three independent experiments). B–D, Venn diagrams showing the number of β-cell genes whose expression was modified by cytokines and that were either STAT1- or IRF-1-dependent after 2 h (B), 12 h (C), or 24 h (D) of cytokine (Cyt.) exposure. E, mean percentage of probe sets considered as present in the three microarray experiments that were differentially regulated by STAT1/IRF-1 silencing and/or cytokine treatment at 2 h (white bars), 12 h (black bars), or 24 h (hatched bars) of cytokine treatment in the different conditions indicated. Results of three independent array experiments were analyzed. mRNA expression was considered as modified by cytokines when p < 0.02 and fold change >1.5 as compared with untransfected cells not treated with cytokines (Untransfected) or si-control-transfected cells not treated with cytokines (siCtrl).
FIGURE 3.
FIGURE 3.
STAT1 silencing partially prevents cytokine-induced down-regulation of genes involved in β-cell differentiation and function. INS-1E cells (A–E) or primary FACS-purified rat β-cells (F) were left untransfected (NT) or transfected with 30 nm of si-control, siIRF-1, or siSTAT1. After 24 h of recovery post-transfection, cells were left untreated or exposed to 10 units/ml IL-1β and 100 units/ml IFN-γ for 2, 12, or 24 h as indicated. Expression of genes related to β-cell function (A and B) or regulatory transcription factors (C and D) were analyzed by microarray. Results represent the mean fold variations ± S.E. of the genes as compared with untreated controls after 12 h (A and C) or 24 h (B and D) of cytokine treatment (n = 3). Statistical analyses for the represented genes are described in supplemental Table 1. E, independent confirmation experiments in INS-1E cells Ins1, Glut2, Pdx1, and MafA mRNA expression were assayed by real-time RT-PCR and normalized for the housekeeping gene GAPDH. Results are mean ± S.E. of four independent experiments. F, confirmation experiments in primary rat β-cells. Ins1, Glut2, Pdx1, and MafA mRNA expression was assayed by real-time RT-PCR and normalized for the housekeeping gene GAPDH. Results are mean ± S.E. of five independent experiments. *, p < 0.05; **, p < 0.01; and ***, p < 0.001 versus untreated (i.e. not treated with cytokines) or untreated transfected with the same siRNA. §, p < 0.05; §§, p < 0.01; and §§§, p < 0.001 versus untransfected and si-control treated with cytokines at the same time point, ANOVA followed by Student's t test with Bonferroni correction.
FIGURE 4.
FIGURE 4.
Induction of the proapoptotic protein DP5 is partially prevented after STAT1 knockdown. INS-1E cells (A) or primary FACS-sorted rat β-cells (B) were transfected and treated as described in Fig. 1. A and B, DP5 mRNA expression was assayed by real-time RT-PCR and normalized for the housekeeping gene GAPDH. Results are mean ± S.E. of four (A) or five (B) independent experiments. C, INS-1E cells were co-transfected with the DP5 promoter luciferase reporter and control pRL-CMV alone (NT) or in combination with si-control, siIRF-1, or siSTAT1. After 1 day of recovery, cells were left untreated or exposed to 10 units/ml IL-1β and 100 units/ml IFN-γ for 24 h as indicated. Results are mean ± S.E. of five independent experiments and represent fold variation as compared with untreated control condition. *, p < 0.05; **, p < 0.01; and ***, p < 0.001 versus untreated (i.e. not treated with cytokines) or untreated transfected with the same siRNA. §, p < 0.05; §§, p < 0.01; and §§§ p < 0.001 versus NT & si-control treated with cytokines at the same time point, ANOVA followed by Student's t test with Bonferroni correction.
FIGURE 5.
FIGURE 5.
IRF-1 provides a negative feedback on cytokine-induced chemokine production. INS-1E cells (A and B) or primary FACS-sorted rat β-cells (C) were left untransfected (NT), or transfected with 30 nm si-control, siIRF-1, or siSTAT1. After 24 h of recovery, cells were left untreated or exposed to 10 units/ml IL-1β and 100 units/ml IFN-γ for 2, 12, or 24 h as indicated. A, expression of the chemokines CXCL10, CXCL9, CXCL1, CXCL11, CXCL2, and CCL20 were analyzed by microarray. Results represent the mean fold variations ± S.E. of the genes as compared with untreated controls at the same time points (n = 3). Statistical analyses for the represented genes are described in supplemental Table 1. B and C, confirmation experiments in INS-1E cells (B) and primary rat β-cells (C). CXCL10, CXCL9, CXCL1, and CCL20 mRNA expressions were assayed by real-time RT-PCR and normalized for the housekeeping gene GAPDH. Results are mean ± S.E. of four to five independent experiments. *, p < 0.05; **, p < 0.01; and ***, p < 0.001 versus untreated (i.e. not treated with cytokines) or untreated transfected with the same siRNA. §, p < 0.05; §§, p < 0.01; and §§§, p < 0.001 versus untransfected and si-control-treated with cytokines at the same time point, ANOVA followed by Student's t test with Bonferroni correction.
FIGURE 6.
FIGURE 6.
IRF-1 hampers STAT1 activation through the induction of SOCS-1. A, C, and D, INS-1E cells were left untransfected (NT) or transfected with 30 nm si-control, siIRF-1, or siIRF-1 primer 2. After 24 h of recovery, cells were left untreated or exposed to 10 units/ml IL-1β and 100 units/ml IFN-γ for 2, 4, 8, 16, or 24 h as indicated. A, phospho-STAT1, total STAT1, IRF-1, PTPN2, and α-tubulin protein expressions were evaluated by Western blot. Pictures are representative of five independent experiments. B, INS-1E cells were co-transfected with a STAT1 reporter and pRL-CMV alone (NT) or in combination with si-control, siIRF-1, or siIRF-1 primer 2. After 1 day of recovery, cells were left untreated or exposed to 10 units/ml IL-1β and 100 units/ml IFN-γ for 24 h as indicated. Results are mean relative luciferase unit (R.L.U.) ± S.E. of five independent experiments. C and D, IRF-1 and SOCS-1 mRNA expressions were assayed by real-time RT-PCR and normalized for the housekeeping gene GAPDH. Results are mean ± S.E. of four independent experiments. E and F, INS-1E cells were transfected with pCMV-Ctrl or pCMV-IRF-1. After overnight incubation, the cells were left untreated (time 0) or exposed to 10 units/ml IL-1β and 100 units/ml IFN-γ for 2, 4, 8, 16, or 24 h as indicated. E, IRF-1 and α-tubulin protein expressions were evaluated by Western blot in untreated cells 24 h after transfection. Pictures are representative of four independent experiments. F, SOCS-1 mRNA expression was assayed by real-time RT-PCR and normalized for the housekeeping gene GAPDH. Results are mean ± S.E. of four independent experiments. G–J, INS-1E cells were transfected with 30 nm si-control, siSOCS-1, or siSOCS-1 primer 2. After 24 h of recovery, cells were left untreated or exposed to 10 units/ml IL-1β and 100 units/ml IFN-γ for 24 h as indicated. SOCS-1, CXCL1, CXCL9, and CXCL10 mRNA expression was assayed by real-time RT-PCR and normalized for the housekeeping gene GAPDH. Results are mean ± S.E. of four independent experiments. *, p < 0.05; **, p < 0.01; and ***, p < 0.001 versus respective untreated control. §, p < 0.05; §§, p < 0.01; and §§§, p < 0.001 versus respective control treated with cytokines at the same time point, ANOVA followed by Student's t test with Bonferroni correction. K, schematic representation of the suggested regulatory loop controlled by IRF-1 in β-cells. IFN-γ binding to its receptor induces Jak-mediated STAT1 phosphorylation and dimerization (1) and its subsequent migration to the nucleus (2), where it stimulates the transcription of many genes, including chemokines and IRF-1. Once synthesized in the cytoplasm (3), IRF-1 also migrates to the nucleus (4) to stimulate the transcription of several genes including SOCS-1 (5). SOCS-1 may then interfere with Jak-mediated STAT1 phosphorylation (6), hence hampering STAT1 activation over time. In the absence of IRF-1 signaling, the defective SOCS-1 induction allows prolonged Jak-mediated STAT1 phosphorylation (7) and sustained STAT1 activity (8).
FIGURE 7.
FIGURE 7.
Schematic representation of selected cytokine-dependent genes differentially regulated by the transcription factors STAT1 (left), IRF-1 (right), or both STAT1 and IRF-1 (center). Of note, some genes (e.g. chemokines) are regulated, at least in part, in opposite directions by STAT1 and IRF-1.

Similar articles

Cited by

References

    1. Cai L., Dalal C. K., Elowitz M. B. (2008) Nature 455, 485–490 - PMC - PubMed
    1. Estruch F. (2000) FEMS Microbiol. Rev. 24, 469–486 - PubMed
    1. Eizirik D. L., Moore F., Flamez D., Ortis F. (2008) Biochem. Soc. Trans. 36, 321–327 - PubMed
    1. Gepts W. (1965) Diabetes 14, 619–633 - PubMed
    1. Cnop M., Welsh N., Jonas J. C., Jörns A., Lenzen S., Eizirik D. L. (2005) Diabetes 54, S97–107 - PubMed

Publication types

MeSH terms