. 2011 Jan;85(1):165-77.
doi: 10.1128/JVI.01512-10. Epub 2010 Oct 27.

A new model of Epstein-Barr virus infection reveals an important role for early lytic viral protein expression in the development of lymphomas

Affiliations

A new model of Epstein-Barr virus infection reveals an important role for early lytic viral protein expression in the development of lymphomas

Shi-Dong Ma et al. J Virol. 2011 Jan.

Abstract

Epstein-Barr virus (EBV) infects cells in latent or lytic forms, but the role of lytic infection in EBV-induced lymphomas is unclear. Here, we have used a new humanized mouse model, in which both human fetal CD34(+) hematopoietic stem cells and thymus/liver tissue are transplanted, to compare EBV pathogenesis and lymphoma formation following infection with a lytic replication-defective BZLF1-deleted (Z-KO) virus or a lytically active BZLF1(+) control. Both the control and Z-KO viruses established long-term viral latency in all infected animals. The infection appeared well controlled in some animals, but others eventually developed CD20(+) diffuse large B cell lymphomas (DLBCL). Animals infected with the control virus developed tumors more frequently than Z-KO virus-infected animals. Specific immune responses against EBV-infected B cells were generated in mice infected with either the control virus or the Z-KO virus. In both cases, forms of viral latency (type I and type IIB) were observed that are less immunogenic than the highly transforming form (type III) commonly found in tumors of immunocompromised hosts, suggesting that immune pressure contributed to the outcome of the infection. These results point to an important role for lytic EBV infection in the development of B cell lymphomas in the context of an active host immune response.


Figures

FIG. 1.
FIG. 1.
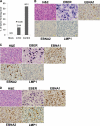
Reconstitution of human hematopoietic cells in NSG mice. Peripheral blood was collected from immune reconstituted hNSG(thy) mice 10 weeks after human fetal CD34 cell transplantation and stained with antibodies specific for human CD45, CD3, and CD19 by flow cytometry. Dead cells were excluded from the analysis. The reconstitution levels in 12 mice that were subsequently infected with control EBV, versus 16 mice that were subsequently infected with Z-KO EBV, are shown. Results are presented as the percentages of positively staining cells with each antibody in comparison to the total leukocyte population.
FIG. 2.
FIG. 2.
Both control and Z-KO virus-infected animals have EBER-positive cells at multiple different sites. Hematoxylin and eosin (H&E) staining and EBER in situ hybridization were performed on a variety of different organs in tumor-free animals infected with the control or Z-KO virus. EBER-positive cells were detected at many different sites, including the nasal lymphoid tissue surrounding the vomeronasal organ (VNO; outlined with hatches; 20× magnification) (A) and muscle (20× magnification) (B). Examples of positively staining cells are illustrated with arrows.
FIG. 3.
FIG. 3.
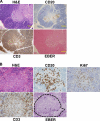
EBER-positive cells travel to specific regions of the transplanted thymic tissue and reconstituted spleen. H&E, EBER, CD20, and CD3 staining was performed on transplanted thymic tissue (20× magnification) (A) and spleen (40× magnification) (B). Ki67 staining was also performed on the cells shown in panel B. EBV-positive cells were primarily located in the medulla region of the thymic tissue and primarily localized to CD20-rich lymphoid zones (outlined with hatches) of the spleen.
FIG. 4.
FIG. 4.
All EBV-positive cells are CD20 positive and some are CD27 positive. Dual color immunohistochemistry was performed using anti-EBNA1 (black) and anti-CD20 (pink) antibodies in transplanted thymic tissue (A) or anti-EBNA1 (black) and anti-CD27 (pink) antibodies in the spleen (B) (both, 100× magnification). EBNA1-positive cells with costaining for CD20 or CD27 are indicated by black arrows, and EBNA1-negative CD20- and CD27-positive cells are indicated by pink arrows.
FIG. 5.
FIG. 5.
Control and Z-KO viruses establish long-term type I and type IIB latency. EBER in situ hybridization, as well as anti-EBNA1, anti-EBNA2, and anti-LMP1 staining, was performed as indicated to determine the type(s) of viral latency established in tumor-free animals. Some slides were also stained for CD20 or CD3 as indicated. Arrows show examples of positively staining cells. (A) Type I latency in a lymph node of a Z-KO virus-infected animal (20× magnification in upper panels and 40× magnification in lower panels). (B) Type IIB latency program in the spleen of a control virus-infected animal; cells expressing EBNA2 are shown with arrows (all, 40× magnification, except the upper right panel shows 100× magnification). Hatches indicate CD20+ lymphoid aggregates. (C) Type IIB latency in the transplanted thymic tissue of a Z-KO virus-infected animal; the Hassal's corpuscles (HC) are outlined with hatches. EBER analysis (20× magnification) and EBNA2 and LMP1 IHC assay (both 100× magnification) are shown. (D) Type IIB latency program in the kidney of a Z-KO virus-infected animal (all, 100× magnification).
FIG. 6.
FIG. 6.
Latency types IIA and III occur rarely in control and Z-KO virus-infected mice. EBER in situ hybridization, as well as anti-EBNA1, anti-EBNA2, and anti-LMP1 staining, was performed as indicated to determine the type(s) of viral latency established in tumor-free animals. (A) Type IIA latency in the kidney of a control virus-infected animal (H&E staining shown at 40× magnification; EBER, EBNA1, EBNA2, and LMP1 staining all shown at 100× magnification). (B) Type III and type IIB latency in transplanted thymic tissue of a Z-KO virus-infected mouse (day 20 postinfection) (all, 100× magnification). Costaining with anti-EBNA2 and anti-LMP1 antibodies reveals that only a portion of the EBNA2-positive cells also express LMP1 (indicated by pink arrows). (C) Type III latency in the liver of a Z-KO virus-infected mouse (day 20) (all, 100× magnification).
FIG. 7.
FIG. 7.
Control EBV infection induces more tumors than Z-KO virus infection in hNSG(thy) mice, and some EBV-positive tumors have restricted latency types. (A) The numbers of EBV-positive tumors in control and Z-KO virus-infected animals are shown (relative to the number of animals infected with each virus). The P value was calculated using a one-tailed Fisher exact test. Animals sacrificed at day 3 and day 20 postinfection were excluded from this analysis. H&E, EBER, EBNA1, EBNA2, and LMP1 staining was performed, as indicated, on a tumor in the liver (type I) of a control virus-infected animal (100× magnification) (B), a tumor in the pancreas of a Z-KO virus-infected animal (type IIB) (100× magnification) (C), and a tumor in the liver of a control virus-infected animal (type III) (100× magnification) (D).
FIG. 8.
FIG. 8.
Cells with lytic EBV infection are found within EBV-induced lymphomas. (A) H&E, EBNA1, BZLF1, BMRF1, and gp350/220 staining was performed on a tumor in the liver (type III) of a control virus-infected hNSG(thy) animal (100× magnification). (B) H&E, EBNA1, BZLF1, BMRF1, and gp350/220 staining was performed as indicated on a tumor in the spleen (type III) of a control virus-infected animal reconstituted with no thymus implantation (100× magnification).
FIG. 9.
FIG. 9.
Infection with both the control and Z-KO viruses induces a host immune response. (A) EBER in situ hybridization and CD20 and CD3 staining were performed on kidney (upper) and muscle (lower) as indicated in tumor-free animals (100× magnification). (B) Proliferation of T cells in response to EBV-infected B cells. Splenocytes were harvested from 4 animals that were mock infected, 5 animals infected with Z-KO virus, and 6 animals infected with the control virus. The splenocytes were depleted of B cells, labeled with CFSE, and then incubated with autologous uninfected B cells or B cells (LCLs) immortalized with the control or Z-KO virus. The plots show the percentages of the total T cells from each mouse that had diluted CFSE fluorescence intensity (indicating that they had proliferated) after 7 to 8 days of culture with the three B cell types shown on the x axes. P values were calculated using a one-tailed paired t test. (C) Cytotoxic responses to EBV-infected B cells. Splenocytes from the indicated virus- or mock-infected animals were depleted of B cells and tested in a 4-h cytotoxicity assay for the ability to kill autologous uninfected B cells or B cells immortalized with the control or Z-KO viruses. The bars show the specific killing (means and standard deviations of results from 3 replicate samples) by effector cells from the indicated animals against the target cell types shown in the legend. The asterisks indicate the cases where no specific killing was detected. (D) Delayed-type hypersensitivity response of EBV-infected animals in response to EBV antigens. Mock- or virally infected animals were injected in the footpad with an EBV antigen preparation or with PBS. The plot shows the change in the thickness of the footpads after the antigen injection compared to preinjection measurements; the results from two mock-infected animals, four control virus-infected animals, and four Z-KO virus-infected animals are included.
FIG. 10.
FIG. 10.
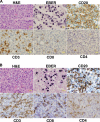
EBV-induced lymphomas are infiltrated with T cells. (A) A type III tumor in the kidney of a Z-KO virus-infected animal was stained for EBER, CD3, CD8, and CD4 as indicated (100× magnification); (B) EBER/CD20/CD3/CD4/CD8 staining of a type IIB tumor surrounding the bile duct in a control virus-infected animal (100× magnification).

References

    1. Bandobashi, K., A. Liu, N. Nagy, L. L. Kis, J. Nishikawa, M. Bjorkholm, G. Klein, and E. Klein. 2005. EBV infection induces expression of the transcription factors ATF-2/c-Jun in B lymphocytes but not in B-CLL cells. Virus Genes 30:323-330. - PubMed
    1. Cayrol, C., and E. K. Flemington. 1995. Identification of cellular target genes of the Epstein-Barr virus transactivator Zta: activation of transforming growth factor βigh3 (TGF-βigh3) and TGF-β1. J. Virol. 69:4206-4212. - PMC - PubMed
    1. Chapman, A. L., and A. B. Rickinson. 1998. Epstein-Barr virus in Hodgkin's disease. Ann. Oncol. 9(Suppl. 5):S5-S16. - PubMed
    1. Cocco, M., C. Bellan, R. Tussiwand, D. Corti, E. Traggiai, S. Lazzi, S. Mannucci, L. Bronz, N. Palummo, C. Ginanneschi, P. Tosi, A. Lanzavecchia, M. G. Manz, and L. Leoncini. 2008. CD34+ cord blood cell-transplanted Rag2−/− γc−/− mice as a model for Epstein-Barr virus infection. Am. J. Pathol. 173:1369-1378. - PMC - PubMed
    1. Cohen, J. I., C. M. Bollard, R. Khanna, and S. Pittaluga. 2008. Current understanding of the role of Epstein-Barr virus in lymphomagenesis and therapeutic approaches to EBV-associated lymphomas. Leuk. Lymphoma 49(Suppl. 1):27-34. - PMC - PubMed

Publication types

MeSH terms