. 2010 Oct 27;30(43):14305-17.
doi: 10.1523/JNEUROSCI.2371-10.2010.

Decision threshold modulation in the human brain

Affiliations

Decision threshold modulation in the human brain

Philippe Domenech et al. J Neurosci. .

Abstract

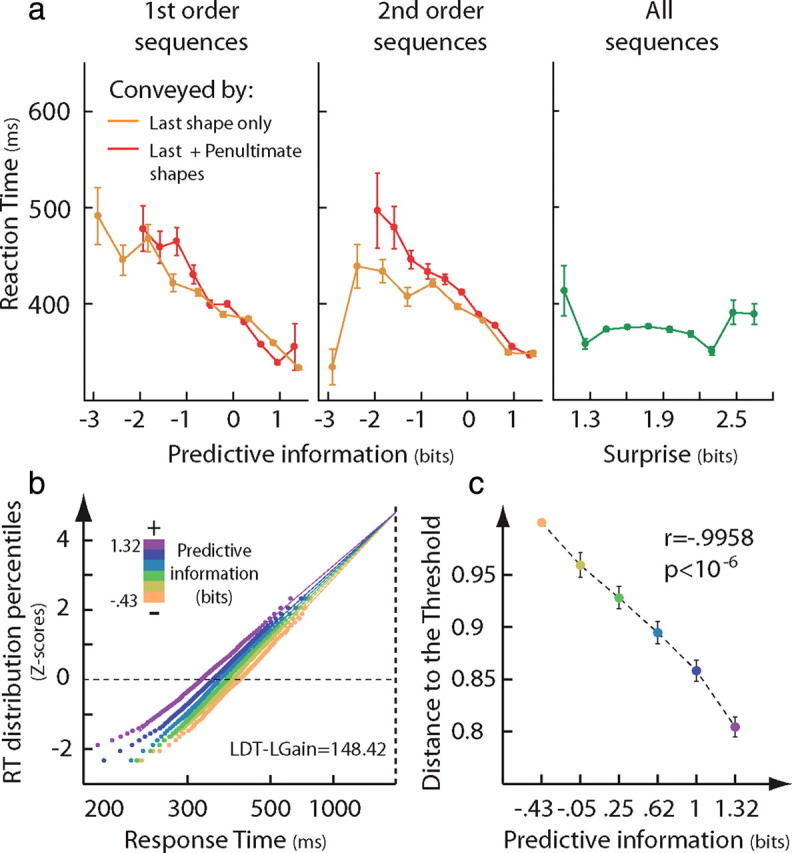
Perceptual decisions are made when sensory evidence accumulated over time reaches a decision threshold. Because decisions are also guided by prior information, one important factor that is likely to shape how a decision is adaptively tuned to its context is the predictability of forthcoming events. However, little is known about the mechanisms underlying this contextual regulation of the perceptual decision-making process. Mathematical models of decision making predict two possible mechanisms supporting this regulation: an adjustment of the distance to the decision threshold, which leads to a change in the amount of accumulated evidence required to make a decision, or a gain control of the sensory evidence, leading to a change in the slope of the sensory evidence accumulation. Here, we show that predictability of the forthcoming event reduces the distance to the threshold of the decision. Then, combining model-driven fMRI and the framework of information theory, we show that the anterior cingulate cortex (ACC) adjusts the distance to the decision threshold in proportion to the current amount of predictive information and that the dorsolateral cortex (DLPFC) codes the accumulation of sensory evidence. Moreover, the information flow from the ACC to the DLPFC region that accumulates sensory evidence increases when optimal adjustment of the distance to the threshold requires more complex computations, reflecting the increased weight of ACC's regulation signals in the decision process. Our results characterize the respective contributions of the ACC and the DLPFC to contextually optimized decision making.


Figures

Figure 1.
Figure 1.
Hypothetical mechanisms by which predictability of forthcoming events modulates the decision-making process. a, Left panels illustrate the progressive drifts of decision variables toward their respective decision threshold. They also correspond to the activity predicted by the decision model for neural populations accumulating sensory evidence. A decision is made when a decision variable equates its threshold. Right panels illustrate how the reciprobit analysis of RT distributions reveals distinct regulatory mechanisms of the decision process. Threshold modulation hypothesis: Reciprobit lines swivel toward lower RT when predictability increases (top right panel), reflecting the lowering of the decision threshold (top left panel). Gain control hypothesis: Reciprobit lines shift toward lower RT when predictability increases (bottom right panel), reflecting the faster rise of the decision variable toward the decision threshold (bottom left panel). b, Task design. Participants had to identify a target shape out of three shapes by pressing a response button (red stars, ISI = 1.35 ± 0.76 s SD). Unbeknownst to the subjects, the next shape could be predicted on the basis of recent history. In first-order sequences, only the last trial had a predictive value on the next shape, whereas in second-order sequences, both the last and the penultimate trials had a predictive value on the next shape. c, Example of a set of transition rules from a first-order sequence. Arrows represent transitions from one shape to the next one and transition probabilities are indicated nearby each arrow.
Figure 2.
Figure 2.
LATER model. a, When a stimulus is presented, a decision signal rises linearly from the starting point (dashed red line) with an average slope s and a trial-to-trial standard deviation sd. When the signal reaches the decision threshold, a motor response is initiated. In the model, the amount of sensory evidence needed to reach a decision is represented by the difference between the starting point and the decision threshold, representing the distance to the threshold D (Reddi and Carpenter, 2000). b, Relationship between RT distributions, reciprobit plots, and LATER model parameters. The reciprobit plot represents the cumulative 1/RT distribution, linearized by computing z-scores (probit transformation), as a function of RT. This graphical representation of RT distribution has two important features: (1) the intercept with the x = ∞ line solely depends on the mean slope of the decision process and is equal to s/sd; (2) the intercept with the y = 0 line is s/D (which depends on both the slope and the distance to the threshold).
Figure 3.
Figure 3.
Regressors included in the statistical analysis of fMRI data. The main GLM included three categorical and three parametric regressors (see Materials and Methods, General linear model 1: main fMRI data statistical analysis). The three categorical regressors modeled the main steps of perceptual decision making: sensory processing, decision-related activity and motor response. Three parametric regressors were derived from the decision-related regressors and hierarchically orthogonalized. These parametric regressors modeled the modulation of BOLD activity at the time of decision by the surprise and the predictive information conveyed by the last and the penultimate shape.
Figure 4.
Figure 4.
Higher predictive information reduces the distance to the decision threshold. a, RT decreased as predictive information increased in first-order [left panel: rp1 = −0.295 (orange), rp2 = −0.273 (red), both p < 10−6] and second-order sequences [middle panel: rp1 = −0.235 (orange), rp2 = −0.292 (red), both p < 10−6]. During second-order sequences (middle panel), RTs were better correlated with the predictive information conveyed by the last two shapes (red) than with the predictive information conveyed by the last shape only (orange) but not during first-order sequences (left panel), indicating that all available predictive information was used in the regulation of the decision process. Finally, there was no effect of surprise (right panel, green) on RT (rsurprise = −0.02, p = 0.126). b, Reciprobit plot based on pooled RT from all participants showing a swivel toward lower RT when predictive information increases, as hypothesized in Figure 1a (upper right panel). This aspect is confirmed by the log likelihood ratio (LDTLGain), in accordance with the hypothesis of the modulation of the distance to the threshold. c, Distance to the decision threshold as a function of the level of predictive information available. Error bars represent 95% confidence intervals of the distance to the threshold. The color code represents the same levels of predictive information in both panels (from −0.43 to 1.32 bits).
Figure 5.
Figure 5.
Event-related response in the ACC predicts individual ability to use predictive information to modulate the distance to the threshold. a, Parametric response to the amount of predictive information conveyed by the last shape (rendered with a threshold of p < 10−3 uncorrected, activations surviving a threshold of 5% clusterwise corrected across the whole brain are circled in red). The color scale represents the slope of the decrease in activity for an increasing amount of predictive information conveyed by the last shape. Note that it does not reflect deactivation. Also note that additional brain regions (not shown here) also survived the statistical threshold used and are listed in supplemental Table S1 (available at www.jneurosci.org as supplemental material). b, Scatter plots of correspondence between “neural” and “behavioral” sensitivities to predictive information in the ACC (n = 14). For each participant, the two sensitivity measures link event-related responses in the ACC and modulation of RTs. (See Materials and Methods, Correlation between “neural” and “behavioral” sensitivity to predictive information.) Individual differences in “behavioral” sensitivity to predictive information conveyed by the last shape (left) and the penultimate shape (right) were predicted by individual differences in “neural” sensitivity in the ACC. Higher “behavioral” sensitivity to predictive information directly reflects the ability to modulate the distance to the threshold. c, Scatter plots of correspondence between BOLD signal change in the ACC and the distance to the decision threshold (left panel) or the gain of the sensory evidence (right panel). Each point represents the BOLD signal change in the ACC plotted against the distance to the decision threshold estimated using the LATER model averaged over the four levels of predictive information (−0.3, 0.18, 0.72, 1.22 bits) for each subject.
Figure 6.
Figure 6.
Whole-brain analysis of parametric responses to entropy, surprise, error likelihood and prediction error. a, Statistical maps are rendered with a very lenient uncorrected threshold of p = 0.01 to illustrate the absence of effect of these potential confounds in the ACC. Left and right sagittal views are shown in the left and right columns. The cold color scale represents negative correlations and the hot color scale represents positive correlations. b, ROI-average parametric response in the ACC to surprise (U), error likelihood (Error), prediction error (TD), and entropy (H). None of the four parametric regressors explained a significant portion of the BOLD activity in the ACC (NS, not significant).
Figure 7.
Figure 7.
Brain regions coding the decision variable. a, Conjunction map showing the brain regions activated during perceptual decision making in which BOLD activity is negatively modulated by the amount of predictive information conveyed by the last and the penultimate shape. We rendered our map using an uncorrected threshold of p < 0.001 (level of significance used for inference, red voxels) and a threshold of p < 0.005 to show the full extent of the activations (yellow voxels). b, Average parametric response to surprise (u) and predictive information (p1 and p2) in these brain regions. The parametric response to the predictive information conveyed by the last shape (p1) and the penultimate shape (p2) was not significantly different (NS) in any of the regions identified (p1 = p2, orange and red bars; rIPS: p = 0.43; rDLPFC: p = 0.34). There was no parametric response to surprise (u = 0, green bars; rIPS: p = 0.29; rDLPFC: p = 0.8). c, Scatter plots of correspondence between BOLD signal change in the ACC and accumulation's slope average, for each of the brain regions shown in Figure 7a (circled in red; see Materials and Methods, General linear model 3: correlation between BOLD activity and LATER model parameters). Each point represents the BOLD signal change in the ACC and the slope of sensory evidence accumulation estimated using the LATER model averaged over the four levels of predictive information (−0.3, 0.18, 0.72, 1.22 bits) for each subject (see supplemental Fig. S3, available at www.jneurosci.org as supplemental material).
Figure 8.
Figure 8.
Diagram of effective connectivity between ACC and DLPFC. DLPFC subregions in which BOLD signal decreased as the predictive information conveyed by the last shape increased are rendered in blue, DLPFC subregions in which BOLD signal decreased as the predictive information conveyed by the penultimate shape increased are rendered in green and DLPFC subregions in which both effects were present are rendered in red (p < 0.005 uncorrected, for display). Red cluster corresponds to the DLPFC subregion coding the decision variable shown in Figure 7. The plain white circle represents the ACC, which is buried within the medial wall of the frontal cortex. The structural equation model included oriented path (arrows) connecting the ACC and the four functional subregions found in the DLPFC. Dashed circles white indicate the location and the extent of the spheres used for time series extraction. A yellow arrow indicates a significant increase of the path coefficient between first-order and second-order sequences, whereas a black arrow indicates a significant decrease of the path coefficient (all p < 10−2). Finally, white arrows indicate path coefficient variations that are not significant. Variations of effective connectivity from first-order sequences to second-order sequences are indicated as relative variations next to each path (supplemental Table S3, available at www.jneurosci.org as supplemental material, indicates absolute values and statistical significance).

References

    1. Beckmann M, Johansen-Berg H, Rushworth MF. Connectivity-based parcellation of human cingulate cortex and its relation to functional specialization. J Neurosci. 2009;29:1175–1190. - PMC - PubMed
    1. Behrens TE, Woolrich MW, Walton ME, Rushworth MF. Learning the value of information in an uncertain world. Nat Neurosci. 2007;10:1214–1221. - PubMed
    1. Berlyne DE. Uncertainty and conflict: a point of contact between information-theory and behavior-theory concepts. Psychol Rev. 1957;64:329–339. - PubMed
    1. Bestmann S, Harrison LM, Blankenburg F, Mars RB, Haggard P, Friston KJ, Rothwell JC. Influence of uncertainty and surprise on human corticospinal excitability during preparation for action. Curr Biol. 2008;18:775–780. - PMC - PubMed
    1. Bogacz R. Optimal decision network with distributed representation. Neural Netw. 2007a;20:564–576. - PubMed

Publication types

LinkOut - more resources