Cryo-EM structure and rRNA model of a translating eukaryotic 80S ribosome at 5.5-A resolution
- PMID: 20980660
- PMCID: PMC2993355
- DOI: 10.1073/pnas.1009999107
Cryo-EM structure and rRNA model of a translating eukaryotic 80S ribosome at 5.5-A resolution
Abstract
Protein biosynthesis, the translation of the genetic code into polypeptides, occurs on ribonucleoprotein particles called ribosomes. Although X-ray structures of bacterial ribosomes are available, high-resolution structures of eukaryotic 80S ribosomes are lacking. Using cryoelectron microscopy and single-particle reconstruction, we have determined the structure of a translating plant (Triticum aestivum) 80S ribosome at 5.5-Å resolution. This map, together with a 6.1-Å map of a Saccharomyces cerevisiae 80S ribosome, has enabled us to model ∼98% of the rRNA. Accurate assignment of the rRNA expansion segments (ES) and variable regions has revealed unique ES-ES and r-protein-ES interactions, providing insight into the structure and evolution of the eukaryotic ribosome.
Conflict of interest statement
The authors declare no conflict of interest.
Figures
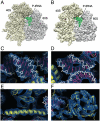
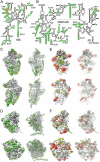
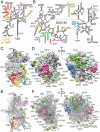
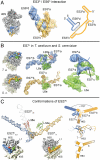
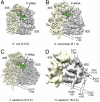
 (gold) and
  (blue) positions (Left), as observed in S. cerevisiae 80S ribosomes (Thumbnail Insets) (39) and an intermediate position (
 , gray) observed in the T. aestivum 80S ribosome. In yeast, r-protein L34e (green) and L38e (red) interact with the
  and
and  positions, respectively. The tunnel exit (TE) and L1 stalk (L1) are indicated for reference. (C) Schematic (Top Right) and molecular model (Middle Right) indicating that the interchange between the
  (gold) and
  (blue) positions involves a rotation of ∼110° of ES27La–c relative to H63. Secondary structure for the junctions of S. cerevisiae ES27La–c and H63.
References
-
- Schmeing TM, Ramakrishnan V. What recent ribosome structures have revealed about the mechanism of translation. Nature. 2009;461:1234–1242. - PubMed
-
- Ogle JM, Ramakrishnan V. Structural insights into translational fidelity. Annu Rev Biochem. 2005;74:129–177. - PubMed
-
- Yusupov MM, et al. Crystal structure of the ribosome at 5.5 A resolution. Science. 2001;292:883–896. - PubMed
Publication types
MeSH terms
Substances
Associated data
- Actions
- Actions
- Actions
- Actions
- Actions
- Actions
- Actions
- Actions
- Actions
LinkOut - more resources
Full Text Sources
Other Literature Sources
Molecular Biology Databases

