Comparative Study
. 2010 Dec;16(12):2293-303.
doi: 10.1261/rna.2345710. Epub 2010 Oct 27.

Modified least-variant set normalization for miRNA microarray

Affiliations
Comparative Study

Modified least-variant set normalization for miRNA microarray

Chen Suo et al. RNA. 2010 Dec.

Abstract

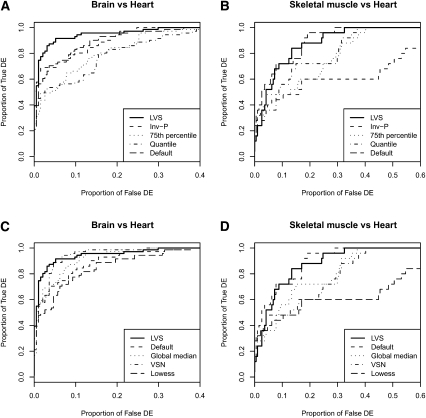
MicroRNAs (miRNAs) are short noncoding RNAs that are involved in post-transcriptional regulation of mRNAs. Microarrays have been employed to measure global miRNA expressions; however, because the number of miRNAs is much smaller than the number of mRNAs, it is not clear whether traditional normalization methods developed for mRNA arrays are suitable for miRNA. This is an important question, since normalization affects downstream analyses of the data. In this paper we develop a least-variant set (LVS) normalization method, which was previously shown to outperform other methods in mRNA analysis when standard assumptions are violated. The selection of the LVS miRNAs is based on a robust linear model fit of the probe-level data that takes into account the considerable differences in variances between probes. In a spike-in study, we show that the LVS has similar operating characteristics, in terms of sensitivity and specificity, compared with the ideal normalization, and it is better than no normalization, 75th percentile-shift, quantile, global median, VSN, and lowess normalization methods. We evaluate four expression-summary measures using a tissue data set; summarization from the robust model performs as well as the others. Finally, comparisons using expression data from two dissimilar tissues and two similar ones show that LVS normalization has better operating characteristics than other normalizations.


Figures

FIGURE 1.
FIGURE 1.
(A) A residual plot for model fitted into one miRNA with approximate median value of Levene's F-value statistics. The random variations of the residuals seem to associate with the fitted values. This pattern indicates that the residual variance is not constant. (B) The distribution of P-values from the Levene test for every miRNA targeted by two or more probes in normal-tissue data. A large proportion of P-values is less than 0.05 indicating homogeneity of variances is violated for most linear models fitted.
FIGURE 2.
FIGURE 2.
RA plots for spike-in data using Normexp background correction (A) or Edwards background correction (B). In both cases the correction is performed on foreground values after local background estimates subtraction. Points below the quantile curves are chosen as the LVS miRNAs.
FIGURE 3.
FIGURE 3.
Sensitivity and specificity of the normalization methods for spike-in data. Proportion of true discoveries are plotted against the proportion of false discoveries. Positives are defined as miRNAs both present and with FC not equal to 1.
FIGURE 4.
FIGURE 4.
Box plots of background corrected probe intensity for normal-tissue data before normalization and summarization on arcsinh scale (A) and after normalization and summarization using LVS on arcsinh scale (B). Different tissues are plotted in order and alternatively colored in white and gray.
FIGURE 5.
FIGURE 5.
Venn diagram for the miRNAs profiled respectively in Lee et al.’s qPCR data, Ach et al.’s microarray, and qPCR data.
FIGURE 6.
FIGURE 6.
Sensitivity and specificity analysis of the normalization methods both in two extremely different tissues (brain and heart) and in two similar tissues (skeletal muscle and heart). Proportion of true discoveries are plotted against the proportion of false discoveries. Positives are defined as miRNAs with a FC (FC = brain or skeletal muscle/heart) >3, either over- or underexpression. Panels (A) and (C) show OC curves for brain vs. heart comparisons for all the different methods considered. Similarly, panels (B) and (D) show OC curves for skeletal muscle vs. heart comparisons. LVS has the advantage of being flexible enough to successfully adapt to either situation.

References

    1. Ach R, Wang H, Curry B 2008. Measuring microRNAs: Comparisons of microarray and quantitative PCR measurements, and of different total RNA prep methods. BMC Biotechnol 8: 69 doi: 10.1186/1472-6750-8-69 - PMC - PubMed
    1. Agilent 2008. Agilent miRNA data import guide. Agilent, Santa Clara, CA
    1. Betel D, Wilson M, Gabow A, Marks D, Sander C 2008. MicroRNA target predictions with expression profiles. Nucleic Acids Res 36: 149–153 - PMC - PubMed
    1. Calza S, Valentini D, Pawitan Y 2007. Normalization of oligonucleotide arrays based on the least-variant set of genes. BMC Bioinformatics 140: 5–9 - PMC - PubMed
    1. Davison TS, Johnson CD, Andruss BF 2006. Analyzing micro-RNA expression using microarrays. Methods Enzymol 411: 14–34 - PubMed

MeSH terms